I have an app that I am using to create clusters based on interview responses. For the end user I need to display these clusters to show the similarities and differences to some interview questions, so I need as many rows as there are interviewees and as many columns as there are interview responses/statements.
A user will land on this page to check/review clusters. In my real app there’s a radio button to change the number of clusters from 3-5, which works. My issue is that the table displays the last column in a weird format, whereas I envisage having far more columns and need to scroll horizontally.
Here’s what it looks like:
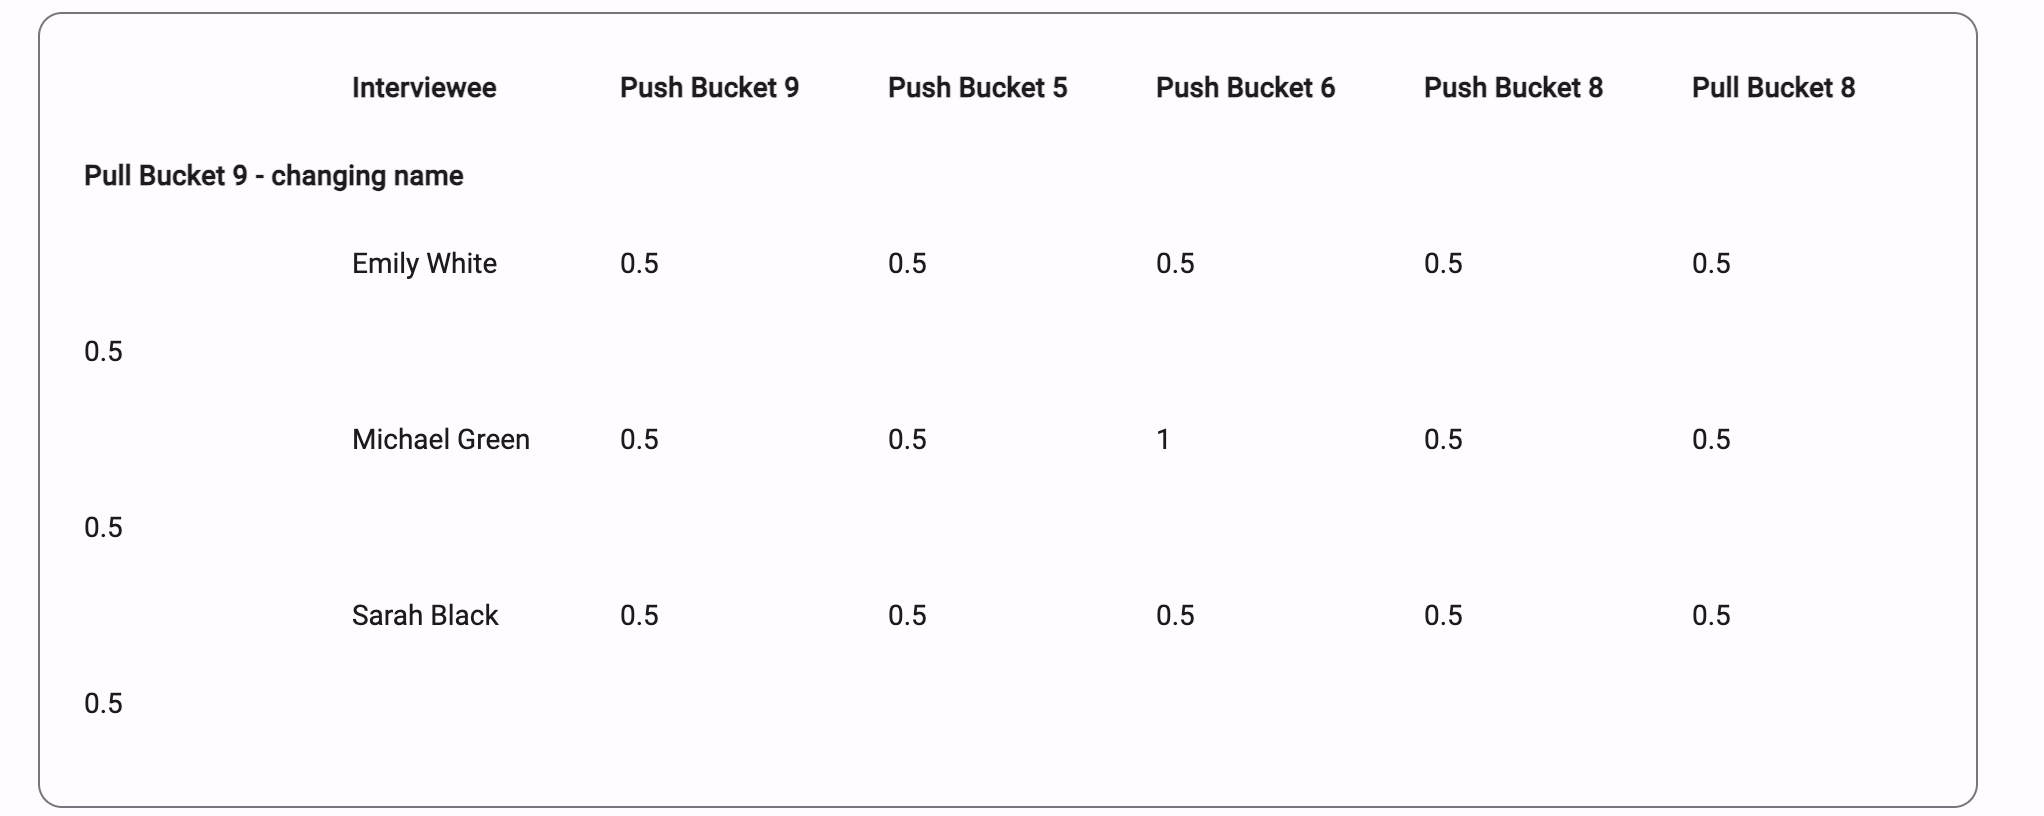
The first column is the Interviewee. The next columns represent statements that they may or may not agree with (for now, dummy rubbish like “Push Bucket 9” but imagine these are “I like chocolate” or similar.
The rows show a 1 if the user agrees, a 0 if they disagree and a 0.5 if they’re a “maybe”.
I need this to dynamically expand based on content from the server to have as many rows as there are interviewees in the cluster, and as many columns as there are statements they were ranked upon or asked about.
I’ve tried full-width rows, inside and outside flow panels, and setting the styling to “horizontal-scroll” using roles.
This code transforms the data from the server into the right format (I think):
def populate_cluster_data_grids(self, cluster_num):
    # Create a dictionary to store data for each cluster
    clusters_data = {i: [] for i in range(1, cluster_num + 1)}

    # Iterate over each interviewee and their data
    for interviewee_name, interviewee_data in self.data["interviewees"].items():
        # Create a dictionary for the interviewee's responses
        interviewee_responses = {"Interviewee": interviewee_name}
        interviewee_responses.update(interviewee_data["responses"])

        # Determine the cluster for the interviewee and append to the appropriate list
        cluster_value = interviewee_data[f"cluster_{cluster_num}"]
        clusters_data[cluster_value].append(interviewee_responses)

    # Bind the data to the respective data grids and set up columns
    for i in range(1, cluster_num + 1):
        grid = getattr(self, f"data_grid_cluster_{i}")

        # Create a list of column dictionaries for each interviewee in the cluster
        columns_list = [{"name": "Interviewee", "data_key": "Interviewee", "id": "colInterviewee"}]
        for idx, statement in enumerate(self.data['global_force_statements']):
            columns_list.append({"name": statement, "data_key": statement, "id": f"col{idx}"})

        # Transform the data for this grid based on interviewee responses
        grid_data = []
        for interviewee_data in clusters_data[i]:
            row_data = {"Interviewee": interviewee_data["Interviewee"]}
            for statement in self.data['global_force_statements']:
                row_data[statement] = interviewee_data.get(statement, "")  # Use get in case some data is missing
            grid_data.append(row_data)

        # Use the helper function
        self.build_common_grid_stuff(grid, grid_data, columns_list)
this code takes that formatted data and builds my data grids:
def build_common_grid_stuff(self, grid, grid_data, columns_list):
    # Set the columns
    grid.columns = columns_list

    # Clear the grid before adding components
    grid.clear()

    # Add column headers
    drp_heading = DataRowPanel()
    for idx, column in enumerate(columns_list):
        drp_heading.add_component(Label(text=column['name'], bold=True), column=f"col{idx}")
    grid.add_component(drp_heading)

    # Add rows
    for row_data in grid_data:
        drp_row = DataRowPanel()
        for idx, column in enumerate(columns_list):
            data_key = column['data_key']
            value = row_data.get(data_key, '')
            drp_row.add_component(Label(text=str(value)), column=f"col{idx}")
        grid.add_component(drp_row)
And this is the styling I’ve tried:
/* This is the new 'role' class'. Any component
with the role "horizontal-scroll" will get this class */
.anvil-role-horizontal-scroll {
  overflow-x:auto;
  border-radius: 12px;
  background-color: %color:Surface%;
  border: solid 1px %color:Outline%;
  padding: 15px;
}
Note I also tried this styling based on another forum question which made it worse (it collapses everything into one column):
.anvil-role-wide .data-grid-child-panel {
  overflow-x: auto;
}

.anvil-role-wide .anvil-data-row-panel {
  flex-wrap: nowrap;
  min-width: -moz-min-content;
  min-width: min-content;
}
Here’s a clone link to show the odd behaviour:
Clone link:
Any ideas what I’m doing wrong?