Do I need to tell my app that we are now in BST or should that be taken care of by the Anvil servers?
I’m using datetime.dateime.now() in a few places in my app, and the outcome is always 1 hour behind. For example, when plotting data I am plotting [now - 1 hour] to now, and the final point is always the one from 1 hour ago.
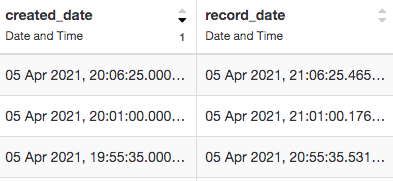
In my data table, I can see that the “created_date” for a row is 1 hour behind (this uses datetime.now() in my Anvil app), but the “record_date” is correct (this is sent via Uplink from a Rasp Pi that seems to accept we are now under BST).
Any ideas on what I need to change or do I need to write some logic into my app to take into account daylight saving nonsense?
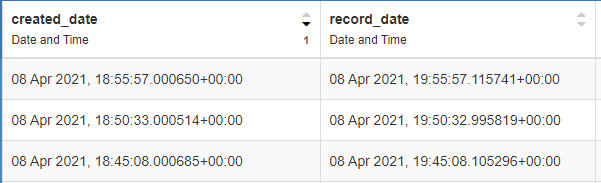
Stretch your datetime columns, so that you see the entire value, and you’ll see the time zone portion of the value. That, plus this documentation, may clarify things a bit.
Ah, I see now. Thank you for the link. I did try searching the docs but didn’t try “time zone” in my search.
So it looks like I’ll need to put something in to check for the time zone indicator and add on an appropriate number of hours to the stored / displayed time. That way I’ll always be showing local time on my plot.
Right, I’ve done plenty of reading and experimenting and I cannot get the behaviour I’m looking for.
What is confusing me is that the date and time I am pulling from my data table is correct, as far as I can see in the table:
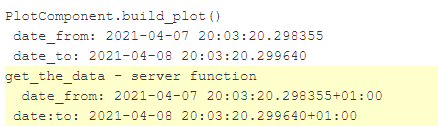
I’m pulling the “record_date” for my plots. The datetime range I am requesting from the data table is what I want. In the screen grab below, the datetime objects with the white background are what I am sending from my client side app to a server function to retrieve the data. The datetime objects with the yellow background are printed from the server function - now they have timezone info.
But when I check the first element of the returned data, I get the following:
One hour behind what I really want. This results in a plot that only shows data up to 1 hour before the current time.
I don’t see a match in the database data displayed so far. (The seconds and fractional seconds should match.) Not seeing enough code (e.g., how was this printed value obtained?) or data (what was the value as stored in the database?) to make any guesses.