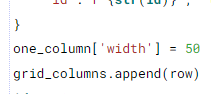
I have a large number (20-ish) in a table in my database which I want to show in a datagrid. I’m using the following code to build it up. However, the columns are written in a very overlapping, jumbled way. I’ve tried two things: setting the width manually for each by setting one_column[‘width’] in the column array I build up, and also added the css found here() to theme.css. Neither has any effect it seems. While width does indeed set the column width, without the ability to scroll horizontally, it still is a jumbled mess.
Could someone point me to a tutorial/doc/forum post which would demonstrate the appropriate way to do this? Thanks in advance!
 def __init__(self, **properties):
        # Set Form properties and Data Bindings.
        self.init_components(**properties)

        # Any code you write here will run when the form opens.
        training_grid = DataGrid()

        columns = app_tables.lms_classes.list_columns()

        id = 0

        grid_columns = []
        for one_column in columns:
            row = {
                "id": f"{str(id)}", "title": one_column['name'], "data_key": one_column["name"],
            }
            grid_columns.append(row)
            id += 1

        training_grid.columns = grid_columns

        logger.pprint(training_grid.columns)

        trainings_repeating_panel = RepeatingPanel(item_template=DataRowPanel)

        training_grid.add_component(trainings_repeating_panel)

        self.add_component(training_grid)

        trainings_repeating_panel.items = anvil.server.call('get_trainings')