I was wondering if it is possible to add components to Canvas, like links, in order to make it interactive. More specifically, instead of having a simple text from fill_text, I want to have links, so when I click them, a pop-up will appear. I have tried using the mouse_down event but it wasn’t possible to put a pop-up in the clicked item
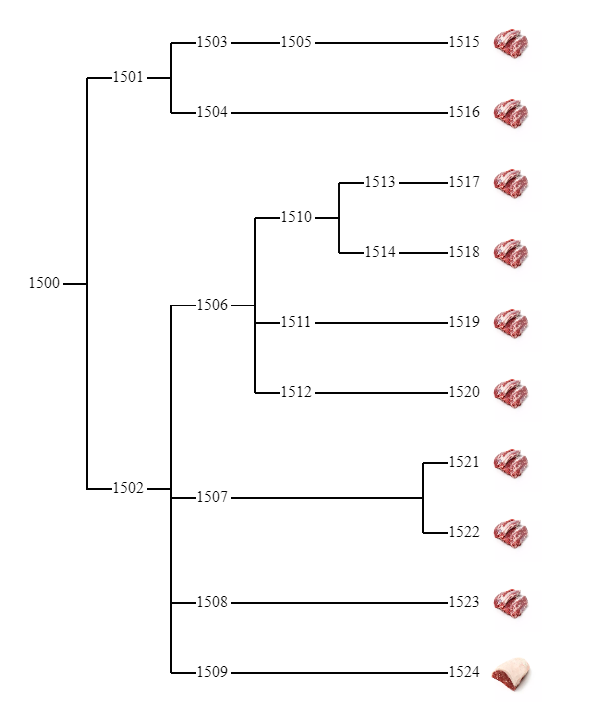
For example, I have a Form that creates a Tree Graph with Canvas as it is shown below in the Image. What I want to do is to be able to click whichever number (eg “1505”) of the picture I want, and have a pop-up utility appeared below it so that I could edit, add, delete etc.
I haven’t tried to place components on top of a canvas, I don’t know if it is possible.
But I have thought about an all canvas solution and I made a little sample app.
Building a complete app is going to be way more involved than dragging a few components. It kind of goes against the Anvil philosophy where everything should be drag and drop, but if you are not afraid about writing some code and playing with classes and the graphics, here is something for you to play with.
That was excellent! Your popover contribution has helped me a lot.
I’ve been meaning to ask, if it is possible to set the position of the popover dynamically?
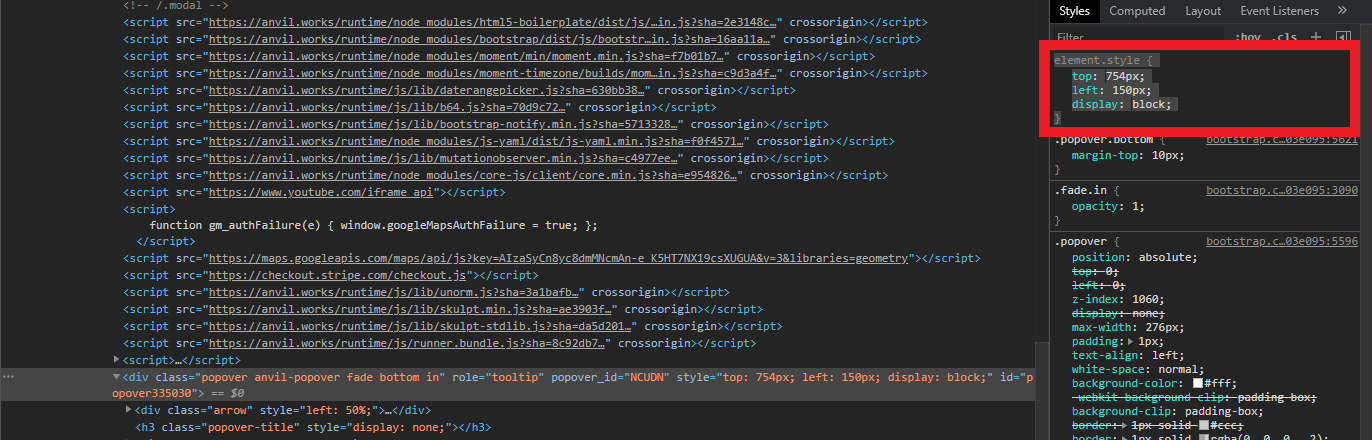
For example, I have a function that draws with canvas a tree graph just like in the picture below. What I want to do is, when I click one of the numbers of the graph (eg ‘1505’), a popover to be shown below of it, just like if it was a link or a button. Right now I have only managed to show the popover below of the canvas, and when I right-click on it and select Inspect, I could change its position in element.style {
top: 754px;
left: 150px;
display: block;
} Picture below
Is there any way to set the element.style programmatically? If yes, then it will be easy for me to tell the popover to pop in the right position in the canvas, since I know the position of every element.
Yes I did think about popovers. I’m sure it can be done. But it’s not exactly how they were designed to be used, so it would need some hacking with the code to get it to do what you wanted.
I also had another idea which you might want to experiment with.
Use an XYPanel.
Then put a canvas panel inside it. But do that in code and not in the designer.
You’ll see why.
class Form1(Form1Template):

  def __init__(self, **properties):
    # Set Form properties and Data Bindings.
    self.init_components(**properties)

    # Any code you write here will run when the form opens.

    self.canvas = Canvas(height=400, spacing_above='none', spacing_below='none') #choose a height (the same as your XY Panel)
    self.canvas.set_event_handler('mouse_down', self.canvas_mouse_down)
    self.xypanel.add_component(self.canvas, width='100%')

  def canvas_mouse_down(self, x, y, button, **event_args):
      l = Link(text='foo')
      self.xypanel.add_component(l, x=x, y=y)
      l.set_event_handler('click', lambda **e: l.remove_from_parent())
You have to add the canvas in code because anvil only supports numbers for the width property in the design view. (we might look at this).
You also might need to play with the padding or adjust the x, y values on click…
Worth noting that the underlying css of an XYPanel places an anvil component at position x,y which translates to css as an absolute position left, top relative to the container.
I was imagining self.canvas was the canvas that already had the Tree Graph rather than a new canvas element.