Testing your extension in Tableau
As you develop your Tableau extension, you’ll want to test it in a Tableau dashboard. To set this up, click Test in Tableau in the top right of the Anvil Editor:

From this dialog, you will be able to download a .trex file (also known as an “extension manifest file”) that will let you add your extension to a Tableau dashboard.
Cloud, Server or Desktop?
Your first question is whether you want to test in Tableau Cloud, Tableau Server or Tableau Desktop. Although many dashboard developers use Tableau Desktop, if you are primarily editing an extension we recommend using Tableau Cloud or Tableau Server.
If you are using Tableau Cloud or Tableau Server, you can test your dashboard inside the Anvil Editor, which lets you edit and test much more quickly.
The Safe List
However, Tableau Cloud and Tableau Server users must go through the extra step of adding their Anvil X extension to the Tableau safe list. Copy the URL from the dialog box, and follow Tableau’s instructions to add your extension to the safe list. Make sure to choose Hide User Prompts – otherwise, you will have to click “yes” every single time you load your dashboard!
Using Tableau Desktop
If you choose to use Tableau Desktop, your task is simple. Download the .trex file and add the extension to your Tableau dashboard (following Tableau’s instructions).
When you load the extension inside Tableau Desktop, a “Tableau Output” panel will appear at the bottom of the Anvil Editor. This will show you live output from print() statements in your extension, or errors if they occur.
When you have updated your extension, and want to test the update in Tableau Desktop, there’s no need to download the .trex file again – just refresh the extension in Tableau. If you’ve used the testing trex file to add your extension, your dashboard will always load whatever version you have open in the Anvil Editor, each time you refresh.
(If you don’t see the “Tableau Output” tab appear, see Troubleshooting: Why is the Tableau Output panel not appearing?)
Using Tableau Cloud or Server
If you are using Tableau Cloud or Tableau Server, the initial workflow is similar to Tableau Desktop:
- Add your extension’s testing URL to the Tableau Safe List
- Download the testing
.trexfile - Add the extension to your Tableau dashboard
When you load your testing extension in Tableau Cloud or Server, the “Tableau Output” panel will appear in the Anvil Editor. This will show you live output from print() statements in your extension, or errors if they occur. If you don’t see the “Tableau Output” tab appear, see Troubleshooting: Why is the Tableau Output panel not appearing?
However, if you are using Tableau Cloud or Server, you can also load your dashboard inside the Anvil editor, for rapid updates and development:
Test your dashboard inside the Anvil Editor
If you’re using Tableau Cloud or Tableau Server, you can load your dashboard live inside the Anvil Editor. This means you don’t have to constantly switch between Anvil and Tableau as you’re testing.
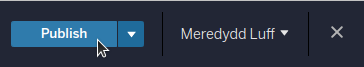
To do this, you’ll need your dashboard’s published URL. To do this, open the dashboard in Tableau Cloud or Server, and click Publish:
This will show a notification, offering “Go to Workbook”. Click that link:

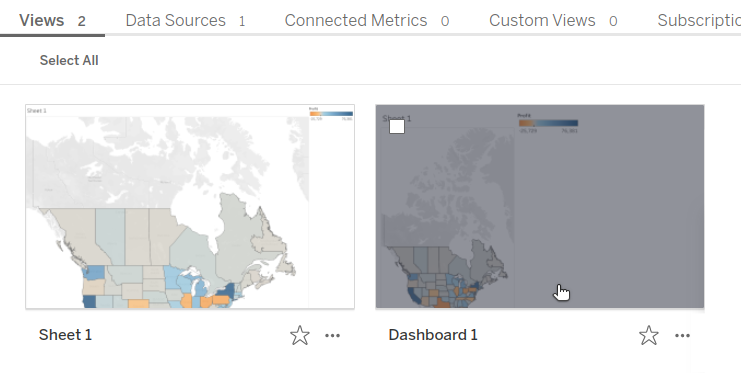
On the following screen, choose the dashboard that contains your extension:
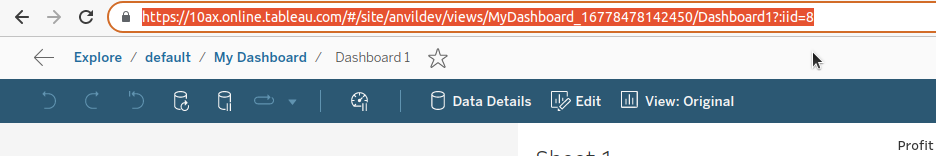
Once your dashboard has loaded, copy the URL from your browser’s navigation bar.
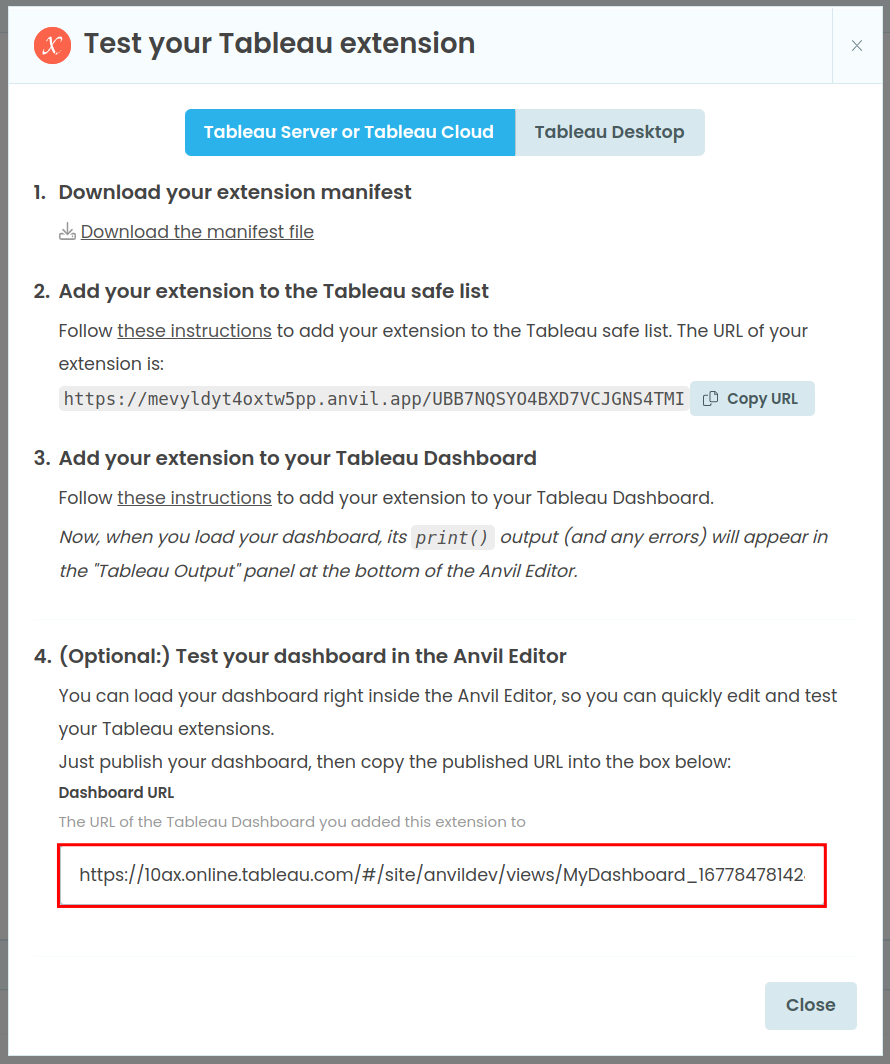
Paste it into the Anvil “Test in Tableau” dialog:
Close the dialog. The green button at the top right will now read Load Dashboard:

When you click Load Dashboard, Anvil will open your dashboard inside the editor. You can make code changes, and click the Restart button to reload the dashboard and instantly see their effects:
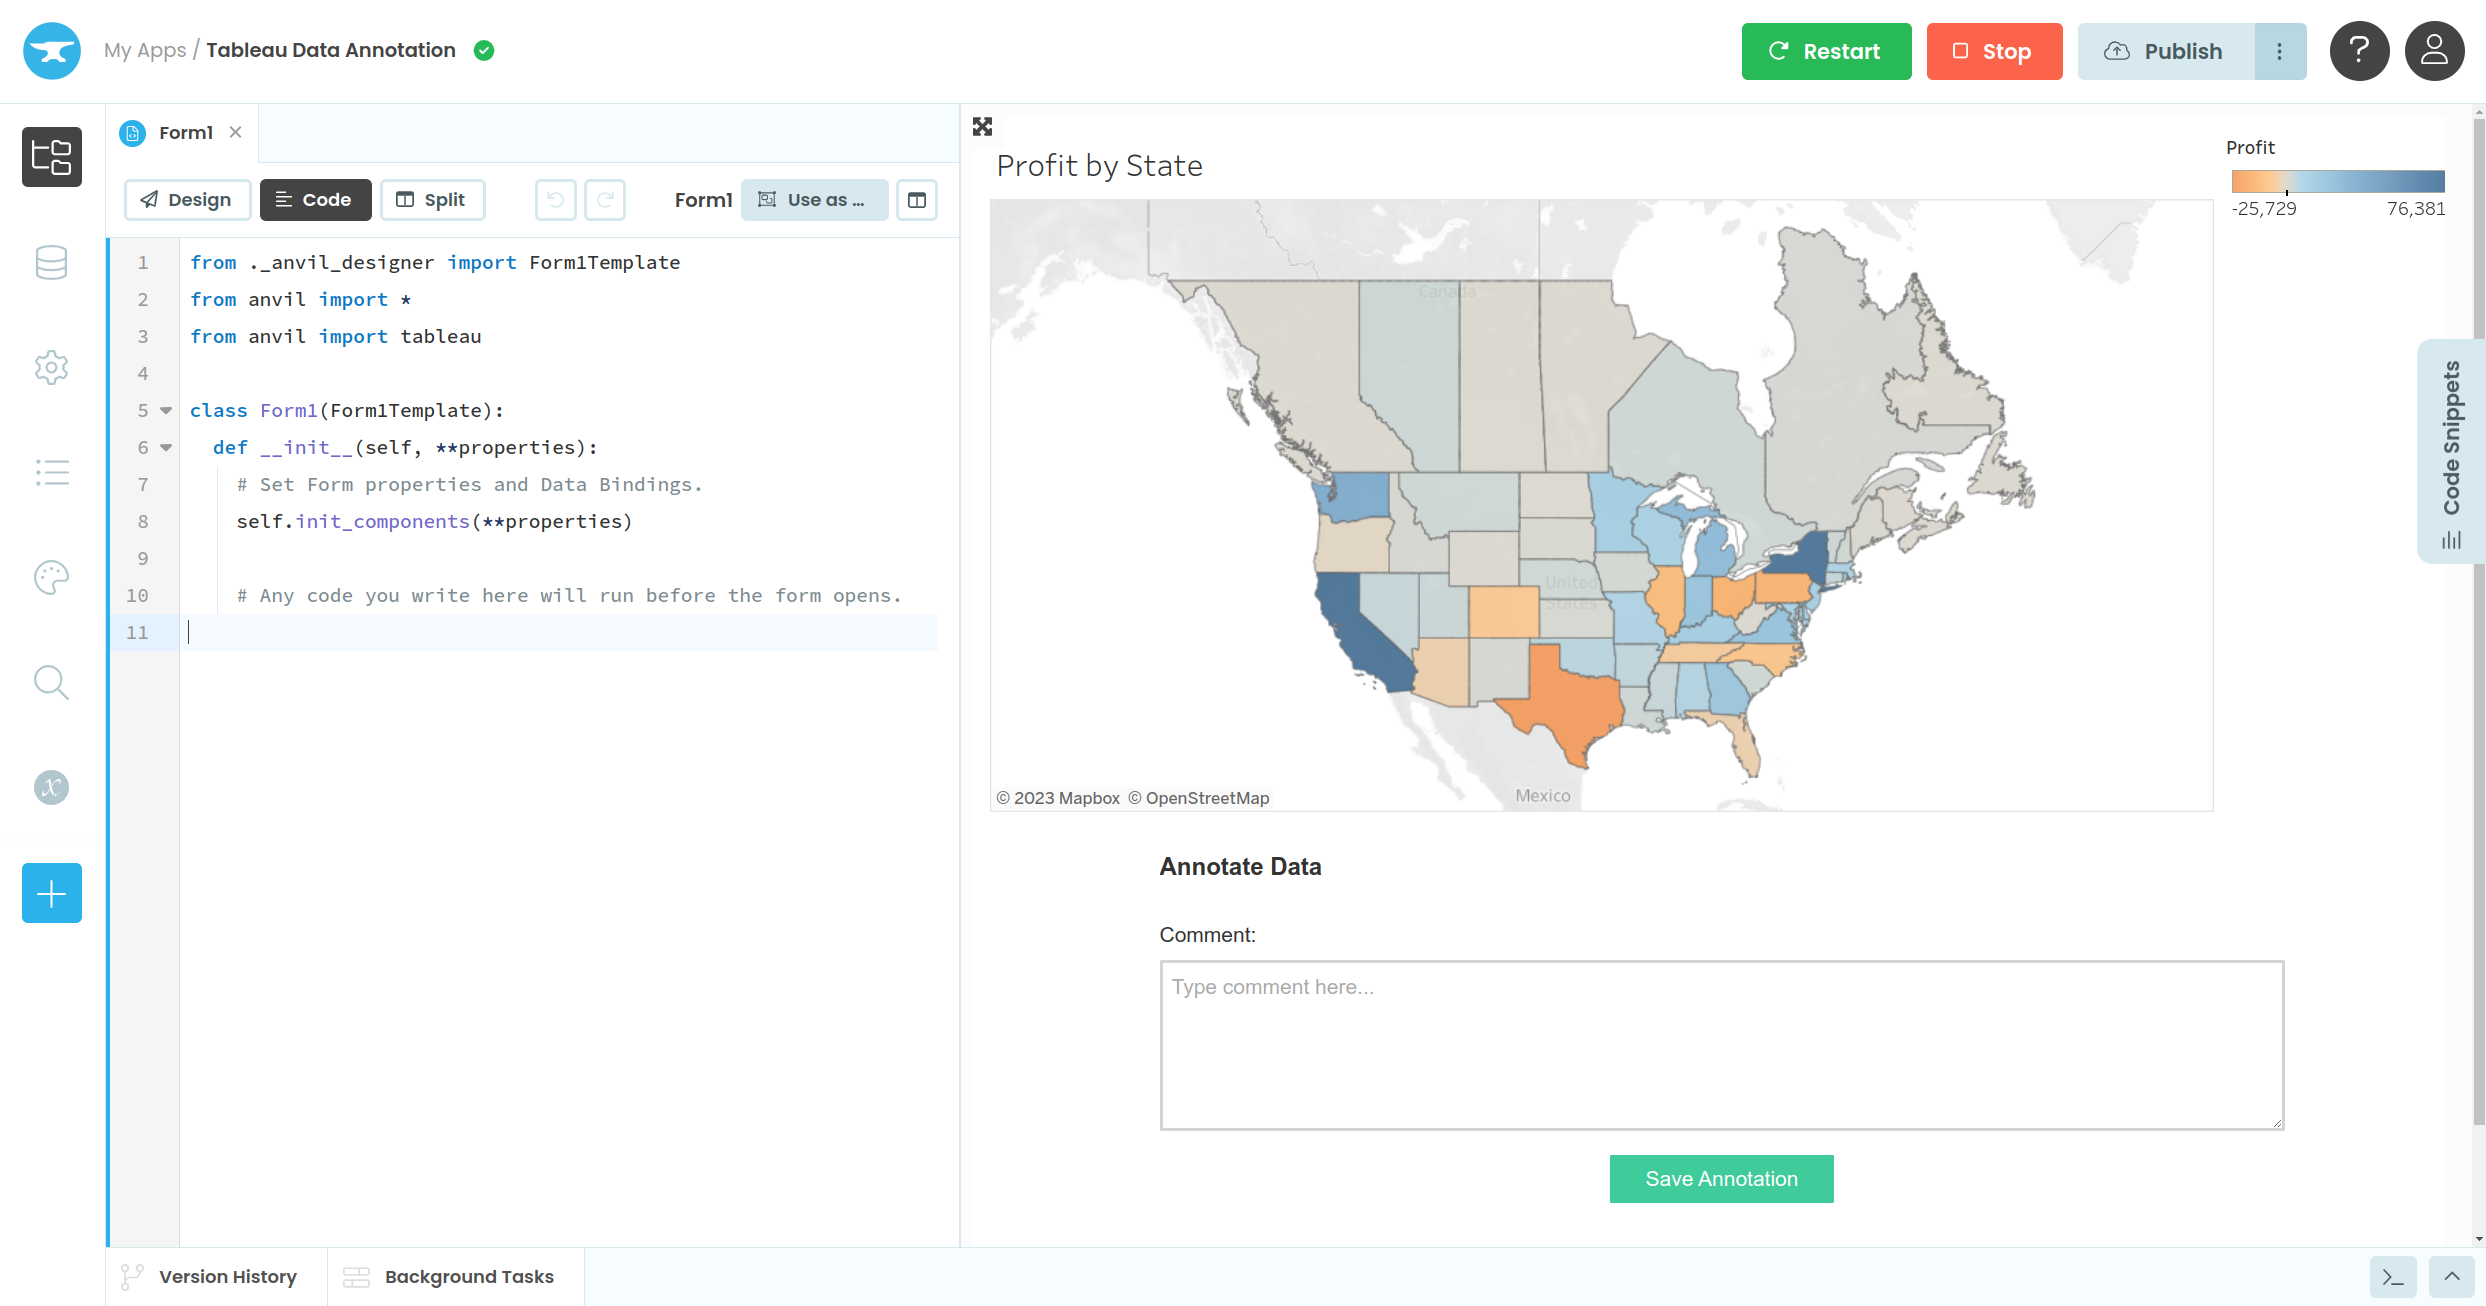
A Tableau extension, running in the Anvil Editor
Getting back to the configuration dialog
To re-open the “Test in Tableau” dialog, click the three dots next to “Test in Tableau”, and choose Configure dashboard…:

Troubleshooting
Why is the Tableau Output panel not appearing?
If you are loading your dashboard, but the “Tableau Output” panel isn’t appearing in Anvil, this probably means that you don’t have your testing version of your extension loaded into that dashboard. Open the “Test in Tableau”/“Configure dashboard” dialog, download your personal testing trex, and make sure that trex is loaded into the dashboard.
If you’re testing your dashboard inside the Anvil Editor, make sure the workbook URL you’re using is
If you have multiple people in a team working on the same extension, make sure each one has their own dashboard with their personal testing .trex file loaded into it.
Tableau says my extension is not on the safe list, even though I added it.
Check for two common problems that can cause this error:
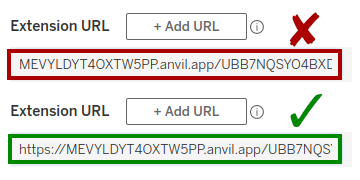
1. Does the extension start with https://?
When you paste an entry into a text box in the Tableau safelist, the text box scrolls to the right, so it can be hard to see the URL. Use the arrow keys to go to the beginning of the URL, and make sure it starts with exactly one https://:
2. Safe-list URLs are case sensitive
Make sure the URL is exactly as you copied it from the “Test in Tableau” dialog box. If you copy from somewhere else (eg a browser URL bar), some of the letters might be switched between upper- and lower-case and Tableau won’t recognise them.
Anvil says my dashboard URL is not valid
When you want to test your dashboard inside the Anvil Editor, you need to provide the view URL for your dashboard. If you’re seeing this error, you have provided the wrong URL to Anvil.
Do you still have questions?
Our Community Forum is full of helpful information and Anvil experts.