Hi @dconnell,
The dash_daq components are designed for use with Plotly Dash. Dash is its own framework, meaning it doesn’t play nicely with Anvil.
However, you can easily make gauge charts using Plotly which we have available in the client-side. Here’s a quick example for you:
https://anvil.works/build#clone:KA7VO6HN7XBEY6PZ=4UF3WAOUE3FN3KQADGWSDACJ
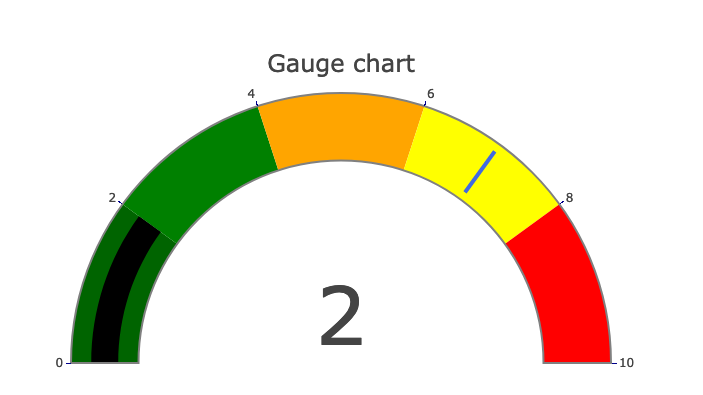
If you need to customise the look and feel a little more, the plotly reference for indicator traces is here.
You can also always drop down to JavaScript, giving you access to the entire universe of JavaScript plotting libraries!