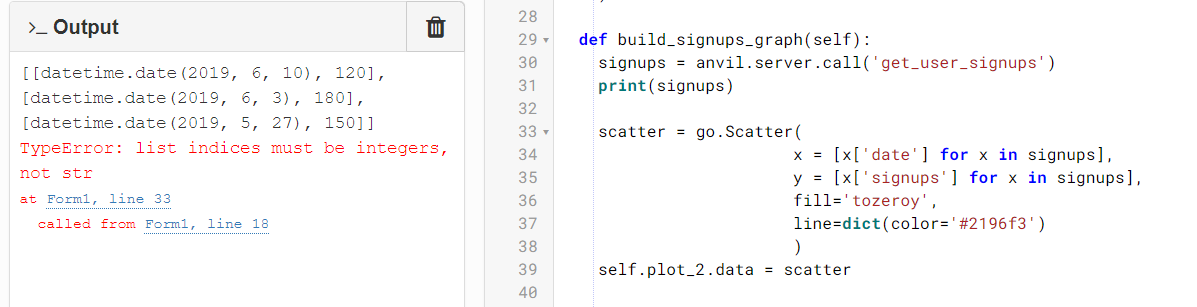
I’m working on the tutorial “Data Dashboard” chapter 4. The chart works perfectly with the dummy data. But, I’m having trouble to make it work with data from my external PostgreSQL database.
The code provided is connecting to my database and getting the data without a problem. But, it comes in a different format that ‘go.Scatter’ cannot handle. Therefore, I’m getting a “*TypeError: list indices must be integers, not str”.
Your plot code is parsing a list of dictionaries, but it looks like you have a list of lists. You reference the index position instead of a key do this instead:
data = [['date1',2],['date2',20]]

x = [x[0] for x in data]
y = [x[1] for x in data]
Plotly is relatively ignorant of missing data, so if you have a date where there is missing data None may be interpreted as a blank. This would mean your resulting y list would be misaligned. This will depend on how your server function is pulling in the data.
Thank you Robert, that was exactly the issue. Your answer helped me to find my solution! Here’s exactly how I did it, in case anyone else finds the same problem while following the tutorials.
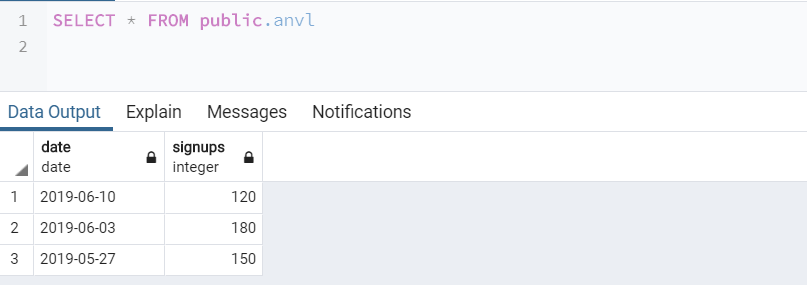
Backend Modified Function - Ch.4, Step 1 @anvil.server.callable
def get_user_signups():
conn = psycopg2.connect(“host=xxxxx.xxxxxxx.amazonaws.com dbname=xxxx user=xxxx password=xxxxxxx”)
cur = conn.cursor()
cur.execute(“”"
SELECT * FROM anvl;
“”")
return list(cur)
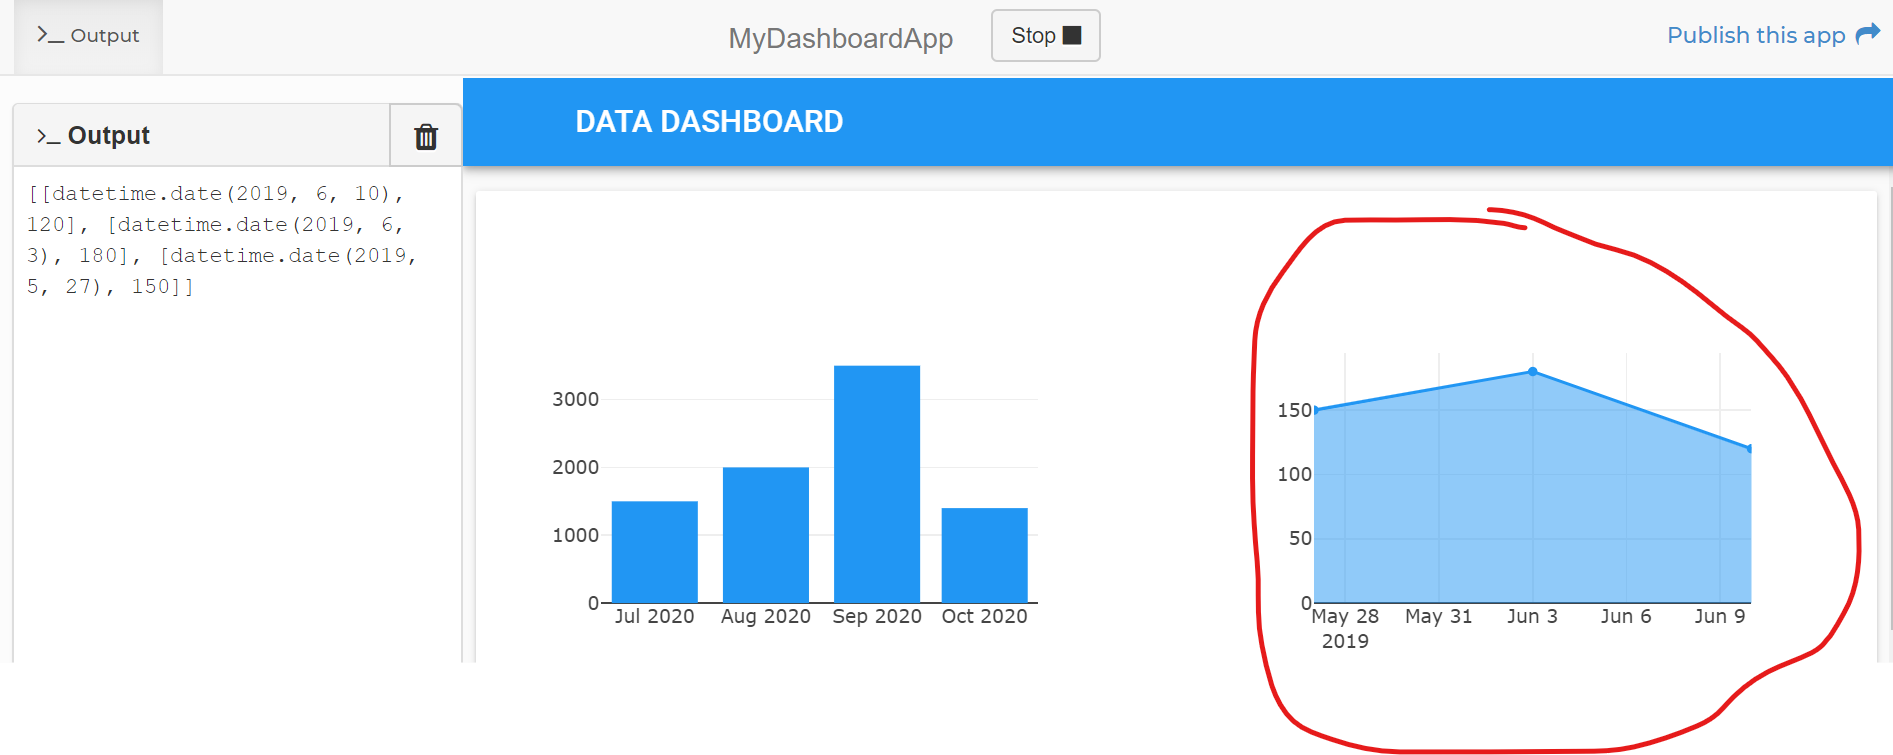
Frontend Function Modified - Ch.4, Step 2
def build_signups_graph(self):
signups = anvil.server.call(‘get_user_signups’)
print(signups)
scatter = go.Scatter(
x = [x[0] for x in signups],
y = [x[1] for x in signups],
fill=‘tozeroy’,
line=dict(color=‘#2196f3’)
)
self.plot_2.data = scatter