What I’m trying to do:
I have one question.
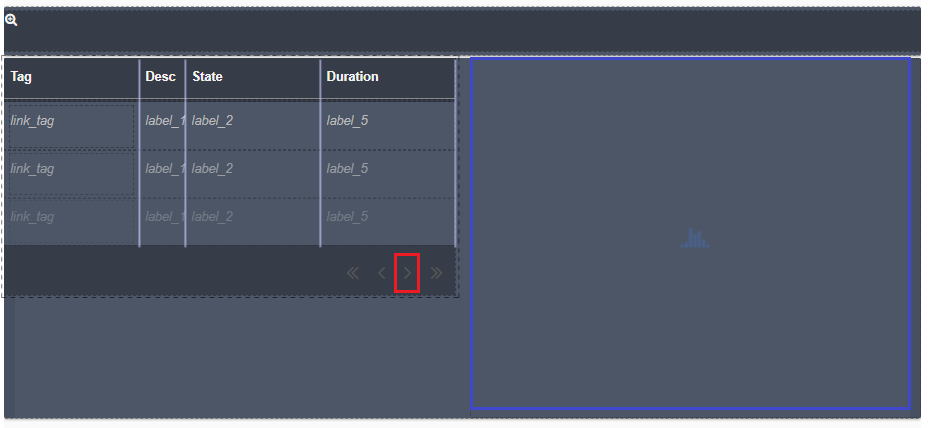
Is there a way to change the graph in the blue box when press the red box?
What I’m trying to do:
I have one question.
Is there a way to change the graph in the blue box when press the red box?
Not in any easy, Anvil-ic way (though there’s probably some way to do it with JavaScript). Those page arrows are actually part of the DataGrid component, but it doesn’t look like its API exposes the click events for those buttons.
The only janky way I can think of is to use a Timer component to “poll” the DataGrid a couple times per second, checking its get_page() method for whether the page has changed.
Another possible approach is to hide the default data grid controls (show_page_controls set to False) and then create a flow panel under your data grid with buttons of your own that call the various page related functions on the data grid (e.g. next_page(), previous_page(), etc).
Since those are your own buttons, you control what happens when they’re clicked, and can adjust your plot as needed.