Slow to run a dashboard

So I made a dashboard that takes about 20 seconds to run which is rather slow for 3 relatively simple graphs I have. While I did my best not to run repetitive data table queries, Is there any guidance on how to optimize for execution time? for example when is it faster to call server code, when client code, time to transfer variables between the two, time to query databases, etc.

Also, can someone recommend any particular execution time profiler/package? I could time methods myself of course, just curious.

Thanks

Generally, as I’ve not seen the code (and I’ve not had my coffee yet) …

  1. try to do all data table lookups in server code, if only from a security perspective of not exposing raw tables to the user.
  2. Try to fetch as much data from a single server call as possible to reduce the round trip overheads.
  3. Avoid unnecessary and repetitive table searches, for example inside nested loops. Re-searching for data you can retrieve once and store can increase times tremendously and I see this done a lot, often by accident.

If the data really does just take along time to retrieve after all of that, then consider using background tasks so the UI can continue to work whilst the data is being collected. Won’t speed things up but gives the user a better experience.

If you fancy sharing a clone link to your project I might be able to help further.

3 Likes

each server call probably costs around 0.3 seconds for the client (without doing anything)… so if you can load a page with 1 server call it’s gonna massively improve things for the client.

for timing on the server I’d probably use a decorator because it makes the code less littered with print statements (adapted from stackoverflow timeit vs decorator)

ServerSide

from functools import wraps
from time import time

def timeit_server(f):
  @wraps(f)
  def wrap(*args, **kwargs):
    str_args    = ', '.join(str(arg) for arg in args)
    str_kwargs  = ', '.join(f"{k}={v}" for k,v in kwargs.items())
    args_kwargs = f"{str_args}, {str_kwargs}" if args and kwargs else f"{str_args}{str_kwargs}"
    
    timelog.print(f'{f.__name__}({args_kwargs}) called')
    ts = time()
    result = f(*args, **kwargs)
    te = time()
    timelog.print(f'{f.__name__} took: {te-ts:.4f} sec')
    return result
  return wrap


@anvil.server.callable
@timeit_server
def f(a):  #example function
  for _ in range(a):
    i = 0
  return -1

Client Side

And then something similar on the client side (without functools and @wraps) like:

def timeit(f):
  def wrap(self, *args, **kwargs):
    str_args    = ', '.join(str(arg) for arg in args)
    str_kwargs  = ', '.join(f"{k}={v}" for k,v in kwargs.items())
    args_kwargs = f"{str_args}, {str_kwargs}" if args and kwargs else f"{str_args}{str_kwargs}"
    
    timelog.print(f'{self.__name__}.{f.__name__}({args_kwargs}) called')
    ts = time()
    result = f(self, *args, **kwargs)
    te = time()
    timelog.print(f'{self.__name__}.{f.__name__} took: {te-ts:.4f} sec')
    return result
  return wrap


class Form1(Form1Template):
  @timeit
  def __init__(self, **properties):
    # Set Form properties and Data Bindings.
    self.init_components(**properties)
    anvil.server.call('f',10000000)

I’ve also used the Logger class from this post to create a timelog Logger so that I can turn it on and off whenever I need.

timelog = Logger(debug=True, msg="timelog:")

here’s a clone of how you might use it:
https://anvil.works/build#clone:BFS7ZTZI4H3OO2UL=N5URW5LHZMPDLTML6KQZDPK2
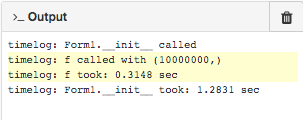
Output looks like:
Screen Shot 2020-01-31 at 15.53.05

4 Likes

You can also check out dev tools console in chrome which often show server calls in bold (RPC request) where 1000ms = 1s.

This has helped me in the past when I thought I was doing 1 server call but was actually doing more than I realised… because I was unpacking a simple object from a Table Row or some other quirk I hadn’t anticipated.

2 Likes

Have a look at this: Suggestions to optimize performance

3 Likes