I am trying to make an app that predicts BTC stock. I created a server module with my code so I could use finance, but when I run it in my client code, an error message appears, reading “anvil.server.TimeoutError: Server code took too long”.
Server Module Code:
import anvil.google.auth, anvil.google.drive, anvil.google.mail
from anvil.google.drive import app_files
import anvil.server
@anvil.server.callable
def stockprediction():
import yfinance as yf
import math
import numpy as np
import matplotlib.pyplot as plt
import pandas as pd
import pandas_datareader as web
import datetime as dt
from sklearn.preprocessing import MinMaxScaler
from keras.models import Sequential
from keras.layers import Dense, Dropout,LSTM
plt.style.use(‘fivethirtyeight’)
#Get today’s date
today = dt.date.today()
#Format the date as a string
today_str = today.strftime(‘%Y-%m-%d’)
#Get the stock quote
Use yfinance to download the data
df = yf.download(‘BTC-USD’, start=‘2012-01-01’, end=today_str)
#Get the number of rows and columns in the dataset
df.shape
#Create a new dataframe with only the close column
data = df.filter([‘Close’])
#Convert the dataframe to a numpy array
dataset = data.values
#Get the number of rows to train the model on
training_data_len = math.ceil( len(dataset) * .8 )
#Scale the data
scaler = MinMaxScaler(feature_range=(0,1))
scaled_data = scaler.fit_transform(dataset)
#Create the scaled training data set
train_data = scaled_data[0:training_data_len, :]
#Split the data into x_train and y_train data sets
x_train =
y_train =
for i in range(60, len(train_data)):
x_train.append(train_data[i-60:i, 0])
y_train.append(train_data[i, 0])
#Convert the x_train and y_train to numpy arrays
x_train, y_train = np.array(x_train), np.array(y_train)
#Reshape the data
x_train = np.reshape(x_train, (x_train.shape[0], x_train.shape[1], 1))
#Build the LSTM model
model = Sequential()
model.add(LSTM(50, return_sequences=True, input_shape= (x_train.shape[1], 1)))
model.add(LSTM(50, return_sequences= False))
model.add(Dense(25))
model.add(Dense(1))
#Compile the model
model.compile(optimizer=‘adam’, loss=‘mean_squared_error’)
#Train the model
model.fit(x_train, y_train, batch_size=1, epochs=1)
#Create the testing data set
test_data = scaled_data[training_data_len - 60: , :]
#Create the data set x_test and y_test
x_test =
for i in range(60, len(test_data)):
x_test.append(test_data[i-60:i,0])
#Convert the data to the numpy array
x_test = np.array(x_test)
#Reshape the data
x_test = np.reshape(x_test, (x_test.shape[0], x_test.shape[1], 1))
#Get the model’s predicted price values
predictions = model.predict(x_test)
predictions = scaler.inverse_transform(predictions)
#plot the data
valid = data[training_data_len:]
valid[‘Predictions’] = predictions
#Predict Next Day
#Assuming ‘data’ contains your entire dataset and ‘Close’ column is the target variable
model_inputs = data[len(data) - len(valid) - 60:].values
model_inputs = model_inputs.reshape(-1, 1)
model_inputs = scaler.transform(model_inputs)
real_data = [model_inputs[len(model_inputs) + 1 - 60:len(model_inputs+1), 0]]
real_data = np.array(real_data)
real_data = np.reshape(real_data, (real_data.shape[0], real_data.shape[1], 1))
prediction = model.predict(real_data)
prediction = scaler.inverse_transform(prediction)
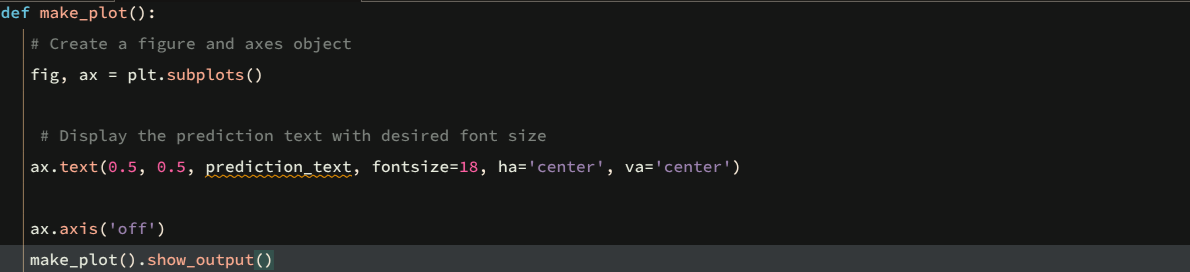
prediction_text = str(prediction[0][0]) # Convert prediction to string
Create a figure and axes object
fig, ax = plt.subplots()
Display the prediction text with desired font size
ax.text(0.5, 0.5, prediction_text, fontsize=18, ha=‘center’, va=‘center’)
ax.axis(‘off’)
plt.show()
Client Code for the necessary page:
from ._anvil_designer import CurrentGraphTemplate
from anvil import *
import anvil.tables as tables
import anvil.tables.query as q
from anvil.tables import app_tables
import plotly.graph_objects as go
import anvil.server
class CurrentGraph(CurrentGraphTemplate):
def init(self, **properties):
# Set Form properties and Data Bindings.
self.init_components(**properties)
# Any code you write here will run before the form opens.
def currentgraph_button_click(self, **event_args):
anvil.server.call(‘stockprediction’)
What should I do to solve this (The code has no errors itself)?