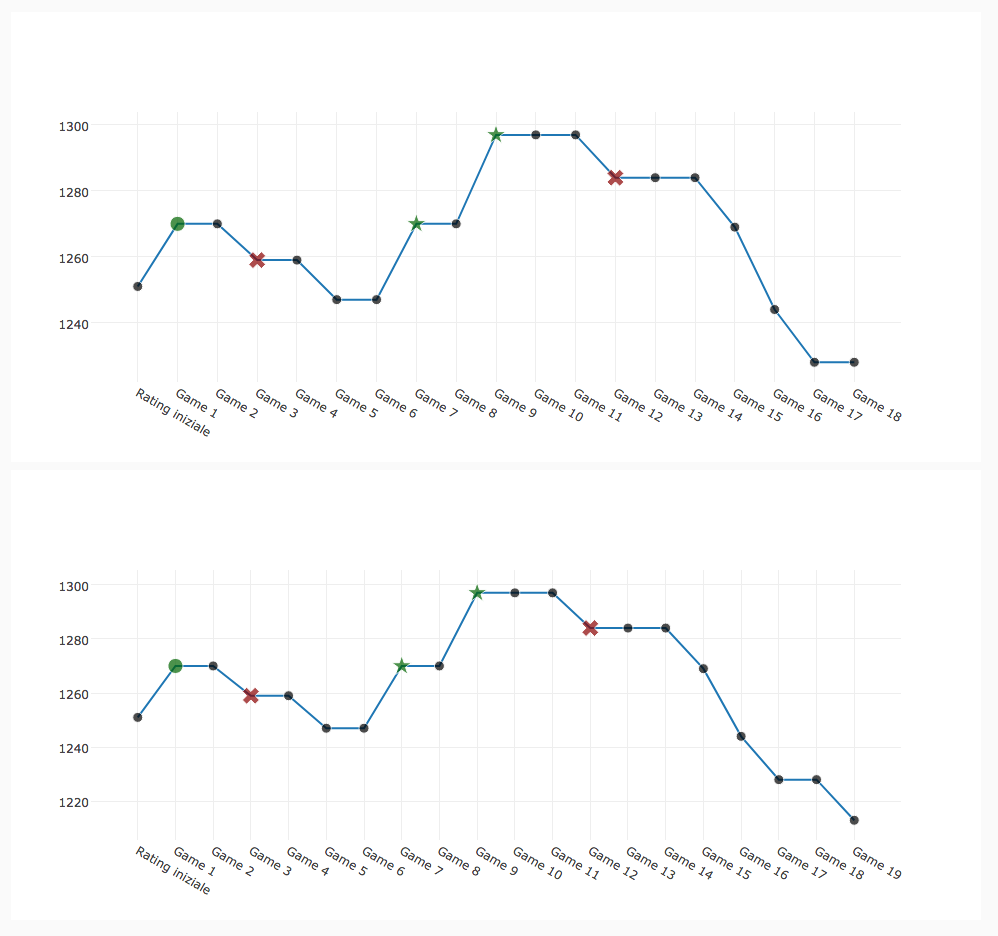
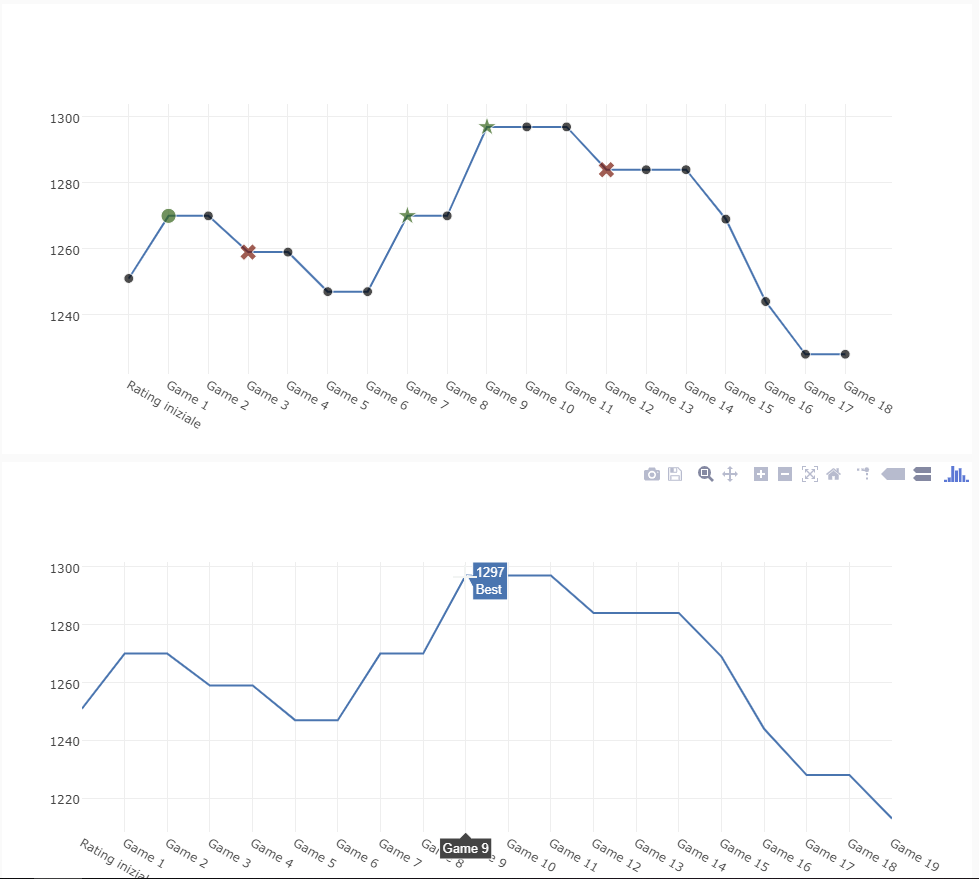
Can someone explain why plotly correctly displays markers symbols up to 19 markers (first plot) and then, when markers are 20 or higher, markers symbols are not shown anymore (second plot)?
Markers texts are working, only symbols don’t.
The code is straightforward:
  def form_show(self, **event_args):
    """This method is called when the HTML panel is shown on the screen"""
    x = ['Rating iniziale', 'Game 1', 'Game 2', 'Game 3', 'Game 4', 'Game 5', 'Game 6', 'Game 7', 'Game 8', 'Game 9', 'Game 10', 'Game 11', 'Game 12', 'Game 13', 'Game 14', 'Game 15', 'Game 16', 'Game 17', 'Game 18', 'Game 19', 'Game 20', 'Game 21']
    y = [1251, 1270, 1270, 1259, 1259, 1247, 1247, 1270, 1270, 1297, 1297, 1297, 1284, 1284, 1284, 1269, 1244, 1228, 1228, 1213, 1203, 1223]
    symbols = [0, 0, 0, 4, 0, 0, 0, 17, 0, 17, 0, 0, 4, 0, 0, 0, 0, 0, 0, 0, 0, 17]
    colors = ['Black', 'DarkGreen', 'Black', 'DarkRed', 'Black', 'Black', 'Black', 'DarkGreen', 'Black', 'DarkGreen', 'Black', 'Black', 'DarkRed', 'Black', 'Black', 'Black', 'Black', 'Black', 'Black', 'Black', 'Black', 'DarkGreen']
    sizes = [10, 15, 10, 15, 10, 10, 10, 15, 10, 15, 10, 10, 15, 10, 10, 10, 10, 10, 10, 10, 10, 15]
    markers_texts = ['', 'Pet! Bravoooo!!', '', 'Worst', '', '', '', 'Best', '', 'Best', '', '', 'Worst', '', '', '', '', '', '', '', '', 'Best']

    marker = dict(symbol=symbols[:19], color=colors[:19], size=sizes[:19])
    self.plot_1.data = go.Scatter(x=x[:19], y=y[:19], marker=marker,text=markers_texts[:19])


    marker = dict(symbol=symbols[:20], color=colors[:20], size=sizes[:20])
    self.plot_2.data = go.Scatter(x=x[:20], y=y[:20], marker=marker,text=markers_texts[:20])
The app is here for you to see it in action:
https://anvil.works/build#clone:ZLGC2ZVGA236ZUOB=IZ43PLDDJREJQ7CAWKGOYOZF
I couldn’t find a reason.
Thanks