I have been trying to track down a performance issue in my code. Finally, I deduced that is is between the server sending and the client receiving. Which I guess is network and compression related.
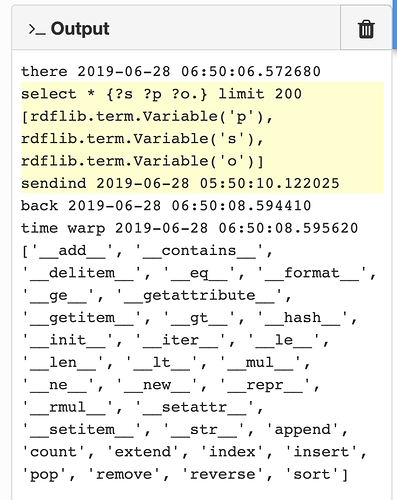
More interesting though is the the print(datetime.now()) gave some very unexpected results. In the attached screenshot you may notice that it reports that between there and back only 2 seconds have elapsed. Yet the stopwatch timing was for 21.6 seconds!!
Any ideas? I’m guessing that the skulp and suspension mechanism has run the print statements well before the suspension resolves. But it could be something else.
Hi Simon,
I think we’re going to need a bit more context to understand what your code is doing here! What’s printing datetime.now() where, and what are you doing between? All I can see here is the output, which doesn’t help me understand what your code is doing 
Hi Simon,
Thanks for sharing your app. How can we replicate the issue? I cloned it, hit Run, and got a login prompt, and no output.
I am happy to help investigate this issue, because if Anvil is misbehaving then we want to fix it. It would really help if you could provide instructions for how to reproduce this issue, so we can get to grips with it!
(A little while ago, I wrote a mini-guide to writing forum questions so they’re easy to answer – some of the tips in there might help!)
The easiest way is to have a screen share session. The long way is to have me supply some data that you load from a local disk. Then send to the knowledge base and then execute a sparql query against the knowledge base.
How do you want to proceed?
On reflection, as I have never tested a new user. The data is plain text. How do I get it to you?Then you would load it onto your local disk and then when you run the program send it to the knowledge base. Finally execute the following query:
select * {?s ?p ?o.} limit 200
You will need to wait about 25 seconds.
Another thought. Using my brand new anvil app I Ioaded the data onto my inrupt POD. Here is the link to collect the data from Tim Berners Lee’s new pet project. https://anvil1.inrupt.net/public/sh.ttl
Let me know if it works.
You might (annoyingly) get the Solid UI from your browser so use a Python http function to GET the resource. OR you may be able to use the url section in the app to get it from my POD without needing a webid and Solid authentication.
Unsure if this is related, but having hugely slow DataGrid rendering with pagination using a small dataset (~2000 rows, 20 columns). You can take a look here: http://recommend.anvil.app. All of the data is being set on load from a list of dicts.
It takes a few seconds for each page flip, and hangs the browser trying to skip to the last page.
I fixed the performance issue by controlling the amount of data being sent between the server and the browser. I guess this can also be alleviated by compressing the data to send it “over the wire”.
This point though was to indicate the the browser showed a different elapsed time to the actual elapsed time. An effect that can be explained by the way in which the architecture handles suspensions (I think).
Thanks for clarifying, mine is NOT the same problem, as I’m pre-sending all the data to the client before rendering. I’ll open a new issue!

