Hi,
when I run the form it take 2sec. Have a look:
from ._anvil_designer import A_report_pdfTemplate
from anvil import *
import anvil.tables as tables
import anvil.tables.query as q
from anvil.tables import app_tables
import anvil.server
from .. import _globals
import datetime
from time import localtime, strftime
from Translations import Translations
class A_report_pdf(A_report_pdfTemplate):
def __init__(self, assessment, optimizer=0, part=0, data_pack=[], **properties):
# Set Form properties and Data Bindings.
self.init_components(**properties)
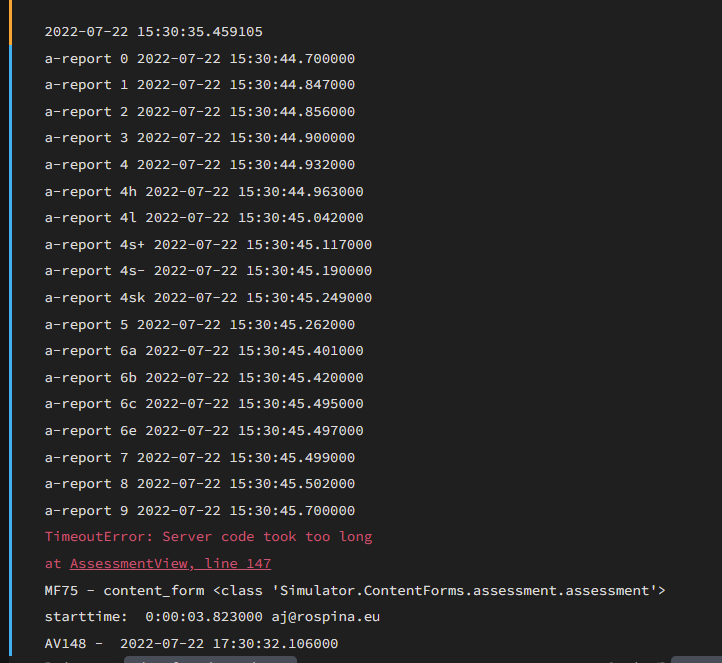
print('a-report 0', datetime.datetime.now())
_globals.language = Translations.LOCALE.lower()
self.label_1.text = "Assessment Report"
self.item = assessment
_globals.simcod = self.item['simcod']
Translations.register_translation(self.label_47, 'text')
self.label_2.text = strftime("%Y-%m-%d ", localtime())
data_times = data_pack[0]
IPS = data_pack[1]
rots = data_pack[2]
gelbs = data_pack[3]
greens = data_pack[4]
anzahl_gleiche_farbe = data_pack[5]
keine_extreme = data_pack[6]
duration = data_pack[7]
self.plot_all_kpi_polar.config['displayModeBar'] = False
#get kpi-chain data
if self.item['kpi_chain']:
self.repeating_panel_chain.visible = True
kpi_chain_text = _globals.kpi_chain(self.item, 'assessment', None)
self.repeating_panel_chain.items = kpi_chain_text
fig_kpi, fig_str, fig_pro, fig_cul = None, None, None, None
self.plot_all_kpi_polar.figure = fig_kpi
self.plot_strategy_polar.figure = fig_str
self.plot_proz_polar.figure = fig_pro
self.plot_cult_polar.figure = fig_cul
print('a-report 1', datetime.datetime.now(),)
if IPS == 0:
ips_text = "very low" if self.item['language']=='en' else 'sehr niedrig'
ips_color = "theme:Rot"
elif IPS <=8:
ips_text = "low" if self.item['language']=='en' else 'niedrig'
ips_color = "theme:Secondary 700"
elif IPS <= 27:
ips_text = "average" if self.item['language']=='en' else 'durchschnittlich'
ips_color = "theme:Gelb"
elif IPS <=64:
ips_text = "high" if self.item['language']=='en' else 'hoch'
ips_color = "theme:Grün"
elif IPS <= 125:
ips_text = "very high" if self.item['language']=='en' else 'sehr hoch'
ips_color = "theme:Grün"
else:
ips_text = "excellent" if self.item['language']=='en' else 'exzellent'
self.button_ips.text = IPS
self.button_ips.background = '#140c76'
if self.item['simcod']=='SUSI':
self.label_ips_is.text = "The Sustainability Power Score of the organisation is "
self.label_4.text = 'Sustainability Power Score'
else:
self.label_ips_is.text = "The Innovation Power Score of the organisation is "
self.label_4.text = 'Innovation Power Score'
self.label_ips_x.text = ips_text
self.label_5.text = "Strategy is about the organisation's ambition for the future and how this is translated into action."
Translations.register_translation(self.label_ips_is, 'text')
Translations.register_translation(self.label_ips_x, 'text')
Translations.register_translation(self.label_5, 'text')
Translations.register_translation(self.label_6, 'text')
#Strategie
print('a-report 2', datetime.datetime.now())
self.plot_strategy_polar.config['displayModeBar'] = False
data_times_strat = data_times[0:6]
data_times_strat.sort(key=lambda item: -item.get('avg'))
self.repeating_panel_strat.items = data_times_strat
#Prozess
self.label_9.text = "Process speaks of efficiency, effectiveness and speed with which the potential for transformation is exploited."
Translations.register_translation(self.label_8, 'text')
Translations.register_translation(self.label_9, 'text')
self.plot_proz_polar.config['displayModeBar'] = False
print('a-report 3', datetime.datetime.now())
data_times_proz = data_times[6:12]
data_times_proz.sort(key=lambda item: -item.get('avg'))
self.repeating_panel_proz.items = data_times_proz
#Kultur
self.label_11.text = "Culture is the necessary human ability, will and permission for transformation to take place."
Translations.register_translation(self.label_10, 'text')
Translations.register_translation(self.label_11, 'text')
self.plot_cult_polar.config['displayModeBar'] = False
print('a-report 4', datetime.datetime.now())
data_times_cult = data_times[12:18]
data_times_cult.sort(key=lambda item: -item.get('avg'))
self.repeating_panel_cult.items = data_times_cult
#highest
print('a-report 4h', datetime.datetime.now())
data_times_high = data_times
data_times_high.sort(key=lambda item: -item.get('avg'))
Translations.register_translation(self.label_12, 'text')
Translations.register_translation(self.label_13, 'text')
self.repeating_panel_highest.items = data_times_high[0:4]
#lowesthighest
print('a-report 4l', datetime.datetime.now())
data_times_low = data_times
data_times_low.sort(key=lambda item: item.get('avg'))
Translations.register_translation(self.label_14, 'text')
Translations.register_translation(self.label_15, 'text')
self.repeating_panel_lowest.items = data_times_low[0:4]
#größte Übereinstimmung
print('a-report 4s+', datetime.datetime.now())
data_times_einheit = data_times
data_times_einheit.sort(key=lambda item: item.get('std'))
Translations.register_translation(self.label_16, 'text')
Translations.register_translation(self.label_17, 'text')
self.repeating_panel_einheit.items = data_times_einheit[0:4]
#niedrigste Übereinstimmung
print('a-report 4s-', datetime.datetime.now())
data_times_spalt = data_times
data_times_spalt.sort(key=lambda item: -item.get('std'))
Translations.register_translation(self.label_18, 'text')
Translations.register_translation(self.label_19, 'text')
self.repeating_panel_spalt.items = data_times_spalt[0:4]
#skipped
print('a-report 4sk', datetime.datetime.now())
data_times_skipped = data_times
data_times_skipped.sort(key=lambda item: -item.get('skipped'))
Translations.register_translation(self.label_20, 'text')
Translations.register_translation(self.label_21, 'text')
self.repeating_panel_skipped.items = data_times_skipped[0:4]
#Dashboard mit Ampelfarben
print('a-report 5', datetime.datetime.now())
board_name = "_/theme/board_"+self.item['simcod'].lower()+"_"+self.item['language'].lower()+".png"
self.image_board1.source = board_name # "_/theme/board_susti.jpg"
self.image_board1.visible = True
self.xy_panel.background = 'theme:White'
x_pos = [ 65, 65, 81,111,156,207,390,440,485,515,530,530,437,391,328,269,207,157,298]
y_pos = [306,251,190,137, 91, 61, 61, 91,137,190,250,306,464,492,509,509,492,464,276]
data_times.sort(key=lambda item: item.get('nr'))
#speichere werte der avg in assessment kpi_list für game später
kpi_list = []
for element in data_times:
kpi_list.append([element['identifier'], element['avg']])
assessment_dict = {'kpi_list': kpi_list}
if app_tables.assessment.has_row(self.item):
assessment_dict['updated'] = datetime.datetime.now()
self.item.update(**assessment_dict)
else:
# Raise an exception if the article doesn't exist in the Data Table
raise Exception("Assessment does not exist")
#zeige Dashboard
print('a-report 6a', datetime.datetime.now())
j, stra_green, proc_green, cult_green = 0,0,0,0
for x, y, d in zip(x_pos, y_pos, data_times):
if d['avg'] < 0:
color = 'theme:Rot'
elif d['avg'] >= 4:
color = 'theme:Grün'
if j<6:
stra_green +=1
if j>5 and j<12:
proc_green +=1
if j>11:
cult_green +=1
else:
color = 'theme:Gelb'
if d['std']>2.39:
color = 'theme:Gray 800'
j+=1
self.xy_panel.add_component( Link(icon='fa:circle', font_size=40, tooltip=d['titel'], foreground=color, visible=True), x=x, y=y)
mittel_wert = (stra_green + proc_green + cult_green) /3
l_ausgewogen = ((stra_green-mittel_wert)**2 + (proc_green-mittel_wert)**2 + (cult_green-mittel_wert)**2)**0.5
print('a-report 6b', datetime.datetime.now())
Translations.register_translation(self.label_22, 'text')
Translations.register_translation(self.label_23, 'text')
Translations.register_translation(self.label_24, 'text')
Translations.register_translation(self.label_25, 'text')
Translations.register_translation(self.label_26, 'text')
Translations.register_translation(self.label_27, 'text')
Translations.register_translation(self.label_28, 'text')
_globals.data_titel = self.item['assessment_title']
self.repeating_panel_ist.items = data_times
print('a-report 6c', datetime.datetime.now())
self.drop_down_units.visible = True
self.repeating_panel_wahl.visible = False
#print('a-report 6d', datetime.datetime.now()) #beide folgende dauern lang
#self.show_compare()
print('a-report 6e', datetime.datetime.now())
#self.create_plot(data_times, self.item['assessment_title'], data_times, self.item['assessment_title'])
print('a-report 7', datetime.datetime.now())
self.label_ips_von_216.text = str(IPS) + " / 216"
self.label_30.text = self.label_ips_is.text # = "The Innovation Power Score of the organisation is "
self.label_ips_bewertung.text = self.label_ips_x.text # = ips_text
self.link_sum_ips.foreground = ips_color
self.label_31.text = "Agreement"
if _globals.assessment_avg_all < 1:
text_avg = "very high"
allavg_color = 'theme:Grün'
elif _globals.assessment_avg_all < 1.5:
text_avg = "high"
allavg_color = 'theme:Grün'
elif _globals.assessment_avg_all < 2.2:
text_avg = "medium"
allavg_color = 'theme:Gelb'
elif _globals.assessment_avg_all < 2.8:
text_avg = "low"
allavg_color = 'theme:Secondary 700'
else:
text_avg = "very low"
allavg_color = 'theme:Rot'
self.link_1.foreground = allavg_color
self.label_32.text = "{:.2f}".format(_globals.assessment_avg_all)
self.label_33.text = "The assessments between the participants is "
self.label_34.text = text_avg
Translations.register_translation(self.label_ips_bewertung, 'text')
Translations.register_translation(self.label_30, 'text')
Translations.register_translation(self.label_31, 'text')
Translations.register_translation(self.label_34, 'text')
Translations.register_translation(self.label_33, 'text')
self.label_37.text = "The balance between dimensions is "
#l_ausgewogen = _globals.ausgewogen
if l_ausgewogen < 1:
text_ausgewogen = "high"
ausgewogen_color = 'theme:Grün'
elif l_ausgewogen < 2:
text_ausgewogen = "medium"
ausgewogen_color = 'theme:Gelb'
else:
text_ausgewogen = "low"
ausgewogen_color = 'theme:Rot'
self.link_2.foreground = ausgewogen_color
self.label_36.text = "{:.2f}".format(l_ausgewogen)
self.label_38.text = text_ausgewogen
Translations.register_translation(self.label_37, 'text')
Translations.register_translation(self.label_38, 'text')
Translations.register_translation(self.label_39, 'text')
print('a-report 8', datetime.datetime.now())
self.repeating_panel_qu1.items = app_tables.a_user_assessment_data.search(q.all_of(assessment=self.item, qu1=q.none_of('')))
self.label_qu1.text = len(self.repeating_panel_qu1.items)
self.repeating_panel_qu2.items = app_tables.a_user_assessment_data.search(q.all_of(assessment=self.item, qu2=q.none_of('')))
self.label_qu2.text = len(self.repeating_panel_qu2.items)
self.repeating_panel_comments.items = app_tables.a_user_assessment_data.search(q.all_of(assessment=self.item, comment=q.none_of('')))
self.label_40.text = len(self.repeating_panel_comments.items)
Translations.register_translation(self.label_42, 'text')
Translations.register_translation(self.label_43, 'text')
Translations.register_translation(self.label_44, 'text')
Translations.register_translation(self.label_45, 'text')
Translations.register_translation(self.label_46, 'text')
self.label_41same_answer.text = anzahl_gleiche_farbe
self.label_43avoid_extrems.text = keine_extreme
self.label_45_duration.text = str("{:.0f}".format(duration[0]/60))+" min. (Max: " + str("{:.0f}".format(duration[2]/60)) + " / Min: " + str("{:.0f}".format(duration[1]/60))