Looking for a way to create something that allows me to edit a node graph that looks a little like this…
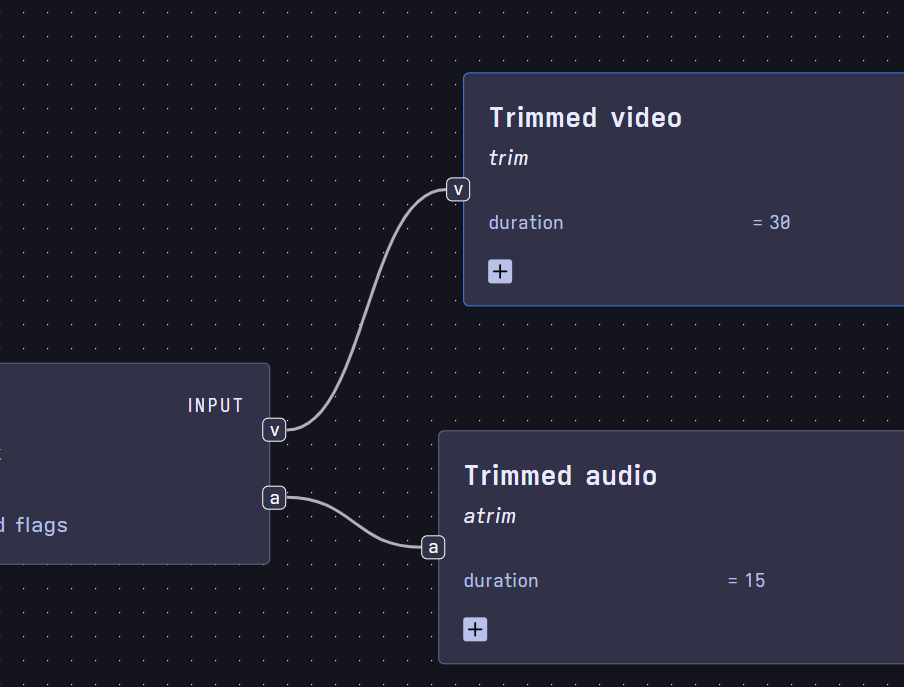
Has anyone found a way to do this easily?
Looking for a way to create something that allows me to edit a node graph that looks a little like this…
Has anyone found a way to do this easily?
Your best bet (other than building it all yourself in a canvas) is to try to integrate a Javascript library that gives you that sort of functionality built-in.
While this js library is no longer maintained, its pretty simple and easy to apply at least for the node lines, so maybe it could do a bit of the legwork:
Yes, I have created an SVG with event management.
No, wasn’t easy.
I had an SVG renderer that would add some boilerplate at the top that included the JavaScript to manage the mouse events, and would expose some add_this or add_that methods that added objects wrapped in their <g>...</g> group tags that responded to events.
If I did it today, I would likely use a canvas as suggested by @jshaffstall, because I know what I can do with it, while with the SVG I was always constrained by the limits and features of what SVG can do.
In other words, if you are an SVG expert and you know where you want to go, perhaps using the SVG features would help and it would be faster and easier, but if you want to build one tool and be done, then the SVG path may lead to unexpected constraints that make you waste more time than helping you.
we have something we did with a canvas but “pretty” curved lines etc feels like it should be readily available!
will keep looking
In terms of Javascript libraries, some casual searching turned up:
I’m sure there are others, too.
thanks for that @jshaffstall you must have been more successful at finding the words for google or git hub to trigger from!
So i think I’m running into the reason why I like anvil and dislike javascript so much! trying to get the simplest litegraph example working, I have been able to get their example working in HTML files locally but when working out how to structure in Anvile to split of code I’ve lost my way,
my failed attempt here, can anyone point out where I’ve gone wrong?
Always try to work from Python entirely with any Javascript integration, your life will be much easier if it works. Only go out to Javascript functions if absolutely needed.
Here’s a clone that shows the basic example you were trying to run, but done entirely in Python and with an Anvil canvas component instead of a canvas hardcoded into the HTML template: Anvil | Login
Awesome thank you, suspect this will answer numerous questions about how to do several other things I want!
Can anything like this be done with an anvil canvas, it seems the litegraph.js library uses a js canvas which any of the anvil canvas methods will then not work on, I found myself switching between the two which is not ideal at all. A way to integrate the curved connector lines on an anvil canvas would be great!
If you look at the clone link example it shows causing litegraph to work with an Anvil canvas.