Hi everyone
I’ve come across an issue with displaying a Matplotlib plot as an image in my app, and I’m wondering if anyone has any ideas as to what might be going on.
What I’m trying to do:
Show a matplotlib plot in an image in the client.
What I’ve tried and what’s not working:
I’ve tried to show a plot using anvil.mpl_util.plot_image(). The code runs and the image component is made visible, but it is blank.
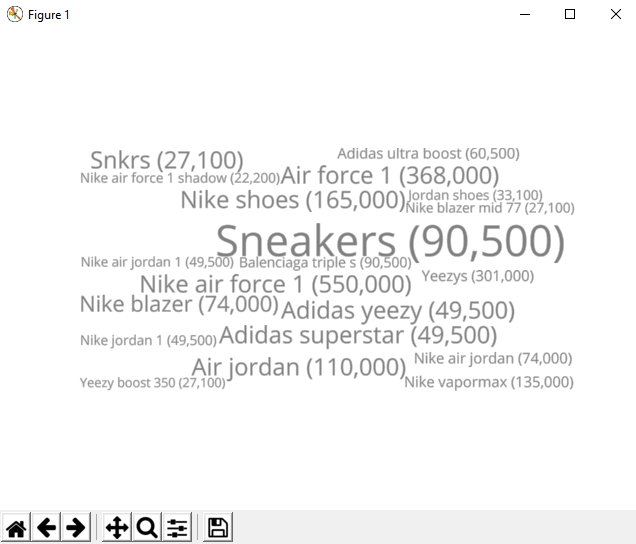
In the test app linked to below, I replaced the example plot with my own plot which works on my local PC. The plot is a wordcloud, I am hoping that doesn’t make a difference - it is shown on my pc using plt.show()
Here’s what it should look like:
Code Sample (on the server module in the test app):
import anvil.server
import multidict as multidict
import numpy as np
from wordcloud import WordCloud
import matplotlib.pyplot as plt
import anvil.mpl_util

@anvil.server.callable
def make_plot():
    # Putting the data into the format for creating the word cloud
    allPhrasesDict = multidict.MultiDict()
    tempDict = {}
    inputDictList = [{'Phrase': 'Sneakers (90,500)', 'Volume': 1}, {'Phrase': 'Air force 1 (368,000)', 'Volume': 0.1}, {'Phrase': 'Nike air force 1 (550,000)', 'Volume': 0.1}, {'Phrase': 'Nike shoes (165,000)', 'Volume': 0.1}, {'Phrase': 'Air jordan (110,000)', 'Volume': 0.1}, {'Phrase': 'Snkrs (27,100)', 'Volume': 0.1}, {'Phrase': 'Adidas yeezy (49,500)', 'Volume': 0.1}, {'Phrase': 'Adidas superstar (49,500)', 'Volume': 0.1}, {'Phrase': 'Nike blazer (74,000)', 'Volume': 0.1}, {'Phrase': 'Nike vapormax (135,000)', 'Volume': 0.1}, {'Phrase': 'Adidas ultra boost (60,500)', 'Volume': 0.1}, {'Phrase': 'Yeezys (301,000)', 'Volume': 0.1}, {'Phrase': 'Nike air jordan (74,000)', 'Volume': 0.1}, {'Phrase': 'Balenciaga triple s (90,500)', 'Volume': 0.1}, {'Phrase': 'Nike air force 1 shadow (22,200)', 'Volume': 0.1}, {'Phrase': 'Jordan shoes (33,100)', 'Volume': 0.1}, {'Phrase': 'Nike blazer mid 77 (27,100)', 'Volume': 0.1}, {'Phrase': 'Nike jordan 1 (49,500)', 'Volume': 0.1}, {'Phrase': 'Nike air jordan 1 (49,500)', 'Volume': 0.1}, {'Phrase': 'Yeezy boost 350 (27,100)', 'Volume': 0.1}]
    for i in range(len(inputDictList)):
        tempDict[inputDictList[i]['Phrase']] = inputDictList[i]['Volume']
    for key in tempDict:
        allPhrasesDict.add(key, tempDict[key])

    # Creation of the wordcloud - works on local PC. The wordcloud is a matplotlib plot, normally shown with plt.show()
    wc = WordCloud(
               background_color='White',
               min_font_size=24,
               max_words=20,
               width=2000,
               height=1000,
               relative_scaling=0.5,
               prefer_horizontal=1,
               random_state=None)

    wc.generate_from_frequencies(allPhrasesDict)

    return anvil.mpl_util.plot_image()
Clone link:
https://anvil.works/build#clone:ZXP6TJVC6ELXOHRM=EXNX6BR4UIK5KRFAXUNJCJ5M
Any ideas?