[maths problem] Work out a strange average

Not an Anvil question, but a maths one.

I have a lower value of 5 and an upper value of 45, but I need random integers between the two values to average 14. This means I need to weight the RNG.

My head won’t play ball - anyone got any ideas on how to do this?

My initial thought was to toss a coin to choose between the whole range or just with an upper value of, say, 15. This means 50% of RNG values would average 10. With the other 50% averaging 25 this would bring the overall average down.

Am I on the right lines (and if so, what should the “lower” upper be to give me an overall avg of 14) ?

Very likely the random module has what you need.
You can look at gauss, but you would need to trim the ends (perhaps there is another one that does it for you), or at triangular.

Thanks @stefano.menci but I’m really interested in the maths behind it.

I need it running in both Python and Lua, so I can’t rely on a library.

I need to specify a minimum, a maximum and a required “average”.

Thanks,

Here’s an Anvil app that uses numpy and the random library to pick from three different distributions, and plot the results.

https://anvil.works/ide#clone:B7EUK42GBSNWWD5X=2VOUNLJAQB6IDMDPHBTC6ZTR

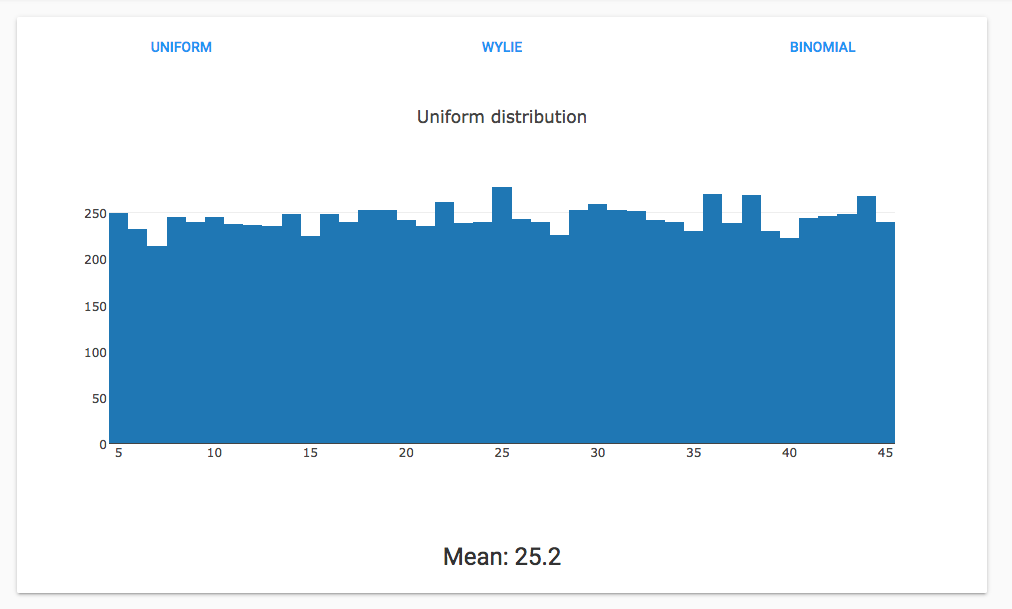
Here’s a uniform distribution between 5 and 45:

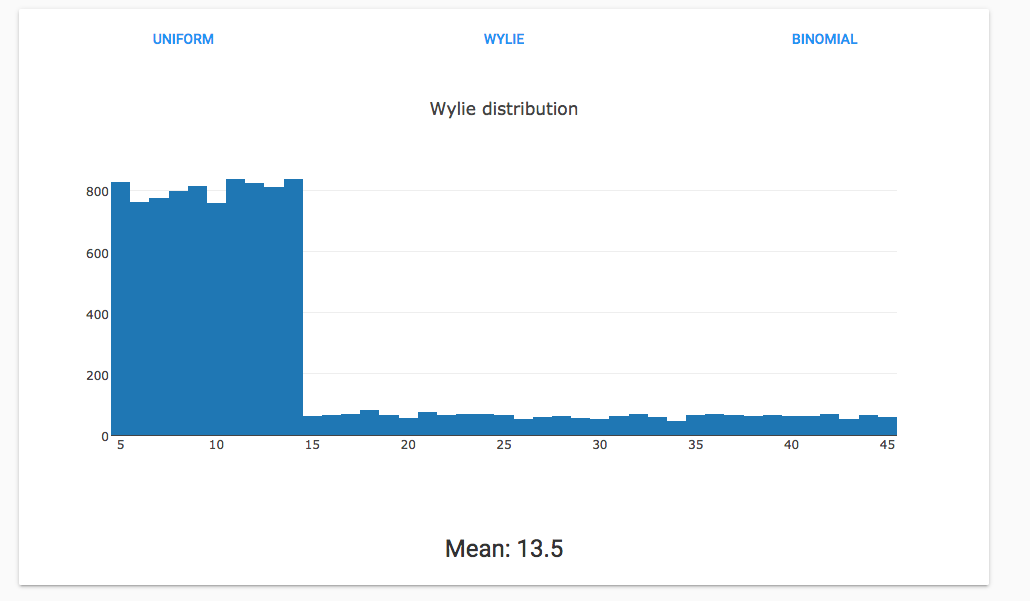
Here’s what happens when you have two uniform distributions that are weighted differently to give a mean of approximately 14:

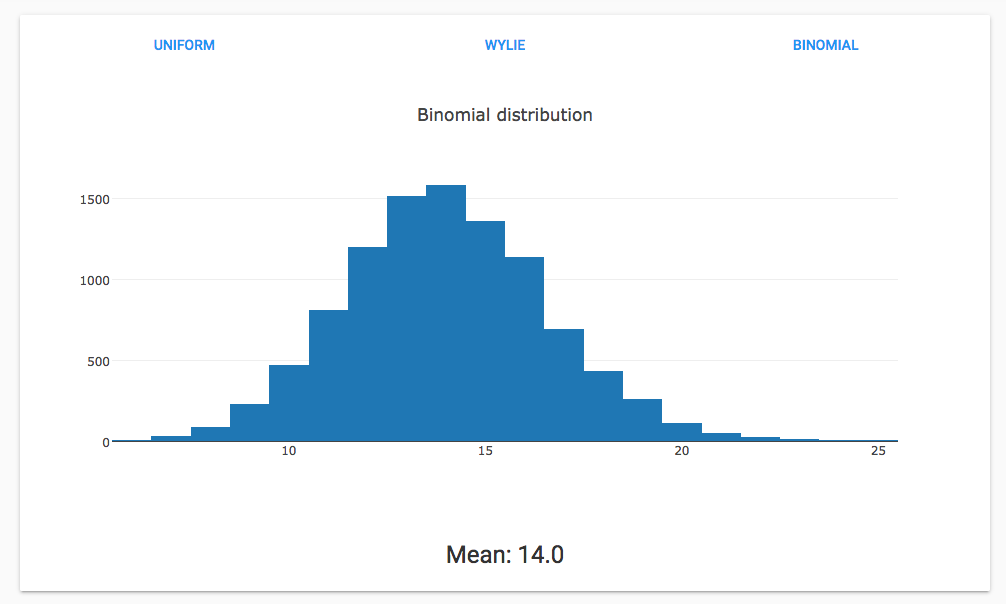
Here’s a Binomial distribution with a mean of 14:

(Credit to @meredydd for the app)

The Wylie distribution picks 4 times from a uniform distribution between 5 and 14 for every 1 pick between 15 and 45.

How to do it without libraries

If you want to do it without needing numpy or the random library, you have to implement an algorithm to pick from a probability distribution yourself. (You still need a random number generator).

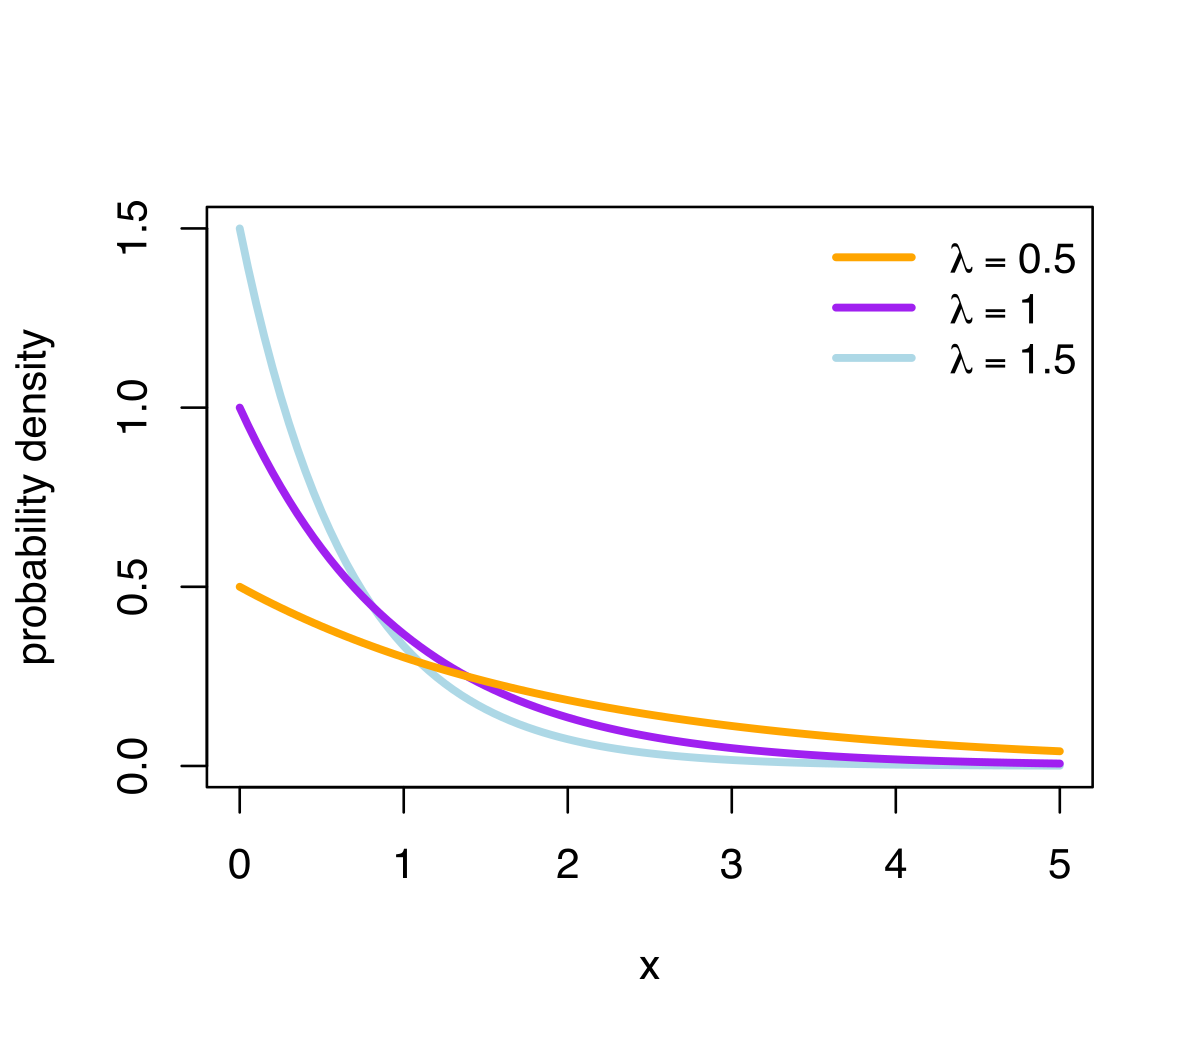
You need to work out a Probability Density Function with a mean of 14, call it f(x). This is the probability of picking a number x. For a uniform distribution, it is constant. For a Normal distribution, it is the familiar ‘bell curve’ (see fig.1 below).

To pick a number from it, you need to have its inverse function, called the Cumulative Distribution Function. Let’s call it f^-1(p). Then:

  1. pick a float from 0 to 1, call it p
  2. calculate f^-1(p)

For example, this is a Normal distribution (fig.1):

And this is its Cumulative Density Function (fig.2):

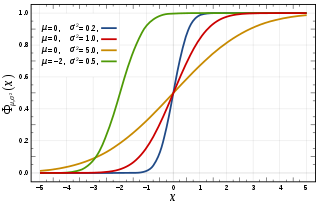
The algorithm I described picks a number on the Y-axis of fig.2. The answer is the corresponding value on the X-axis of fig.2.

You can see that most values picked from the Y-axis of fig.2 are going to come out with an X value near to 0. This makes sense, because most of the probability density in fig.1 is around X=0.

Thanks @shaun.

Think I’ll wait until I have a beer in hand this evening before I attempt to understand this :slight_smile:

1 Like

Hi @shaun,

thank you for taking the time to explain that to me. I suddenly have the need to do this again (with different min/max/avg values), but I’m afraid I don’t understand a word of it.

I understand the principle of picking from range A one time in X, and from range B one time in Y to get a distorted average, but I just cannot get into my thick head how to work this out for any particular min/max/avg values that i might need.

Could I trouble you for an expansion on your explanation geared towards a hammer rather than a precision laser cutter, if you see what I mean?

Actually, reading it again, you seem to be steering me to the binomial distribution rather than my way of choosing between two ranges, i think, err.

Ok, this seems to work, kinda sorta. Would appreciate other’s input.

result =  math.floor((min + (max - min) * math.pow(math.random(), p)))

(Lua code, not Python)

Taken from (and adapted slightly) here (not the accepted answer) :

I would recommend using numpy unless you want to implement something you have low level control of.

Numpy has a module (no.random.randomint) that can generate random values from a uniform distribution (all int equally likely to be output) and you can state a min max. But you said you wanted it skewed to the min side.

In that case I might recommend what Shaun said, and that is to sample from a different distribution. This gets tricky statistically because numpy does not have this built in exactly as you need. One question, is the spread between your min and max values somewhat constant?

If it is, you can sample from a normal distribution (often called a bell curve) and then simply chop off the values outside the min max. To do this you will need to first select your desired mean and standard deviation. The standard deviation will tell your curve how fat or skinny it should be. I’m on a phone now but I can post drawings and code later.

The other option if you need something heavily skewed is an exponential distribution.

This will always start at 0 though. So you can just add the min value to all numbers and it will shift it to where you need. Then cut off the top values.

What I’m proposing is a bit of a ”hackey” way to do it.

This is not going to be done just in Python, but Lua as well (I mention that a bit further up the chain), so I can’t rely on a Python only library anyway.

Well, by the time the total reaches approx. 2,500 the skewed average needs to be at 10 (with min-7 max-25) so I’m not sure if that’s constant in the way you mean.

My head hurts…

Gotcha, no libraries. Sorry about that.

Could you describe the mechanism on how the averages are supposed to change? As the “total” changes the average is also changing?

Edit: I think I understand what you mean by total. The total being the average of the sampled numbers. So when the total numbers of draws from the distribution equals 2,500 the skewed average needs to be at 10.

There are three ways, from easiest to hardest:

  1. Make the distribution in Python (or even Excel) and save it to a CSV. Then you can pull in the data in whatever language you want and pull a random number from the distribution.

  2. Go backwards from a line function (y=mx+b or y=-1.5x+1000) and use this line to hack your way into a random number generator. For the height y of every x value generate y number of x’s. Do that for every int along your range. Then randomly pull from the resulting data. Pretty poor RNG but it will have the desired effect if you don’t care too much about individual trials being very random. Also should have the effect of being easy to code in multiple languages.

  3. Build an algorithm that will do this from scratch, which to be honest is beyond me without a significant time investment.

1 Like

Here is the source code of random.triangular from the Python standard library. Not really normal distribution, but easy to implement in another language and, perhaps, good enough for you.

def triangular(self, low=0.0, high=1.0, mode=None):
    """Triangular distribution.

    Continuous distribution bounded by given lower and upper limits,
    and having a given mode value in-between.

    http://en.wikipedia.org/wiki/Triangular_distribution

    """
    u = self.random()
    try:
        c = 0.5 if mode is None else (mode - low) / (high - low)
    except ZeroDivisionError:
        return low
    if u > c:
        u = 1.0 - u
        c = 1.0 - c
        low, high = high, low
    return low + (high - low) * _sqrt(u * c)
3 Likes

This could work. According to Wikipedia the triangular distribution is symmetrical when c = ( a + b ) / 2 where a and b are the lower and upper bound and c is the mode in the above function.

The default in the example @stefano.menci gave will give you a symmetrical distribution where the mean is in the center of the range. By changing the mode you can skew the distribution left or right.

This is much more elegant than my solution, but it is very peaky.

Thank you all for your suggestions.

I will be trying them out and I’ll post how I get on.