Whats the best way to pull the last X number of rows from the DB for a ploty bar graph?
I tried a few different ways I could think of, and I’m missing something.
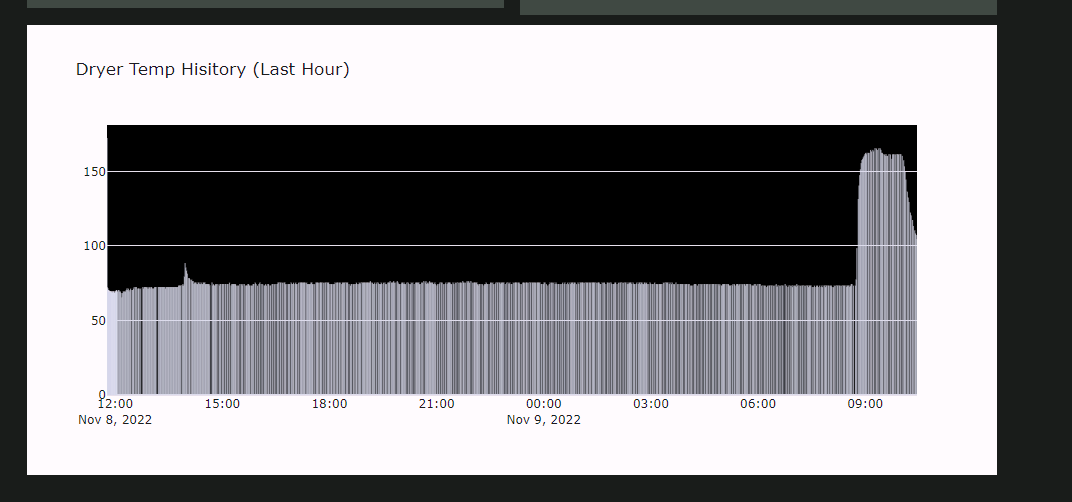
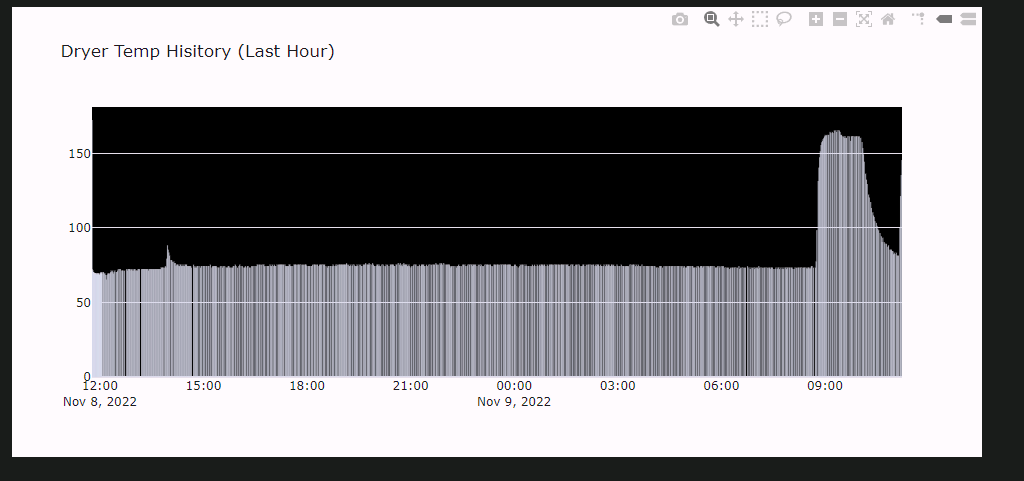
I have an esp32 sending temp data from an oven to Anvil API that inserts into the sensor database. This happens every minute, and for my temp graph I just want the last hour, or roughly last 60 entries.
def build_TempHistory_graph(self):
#self.plot_temp_history.data = go.Bar(y=[100,400,200,300,500])
db_data = anvil.server.call('get_temp_history_plot')
# Create a Bar plot with this data, and change the colour of the markers
self.plot_temp_history.data = go.Bar(
x = [x['timestamp'] for x in db_data],
y = [x['Temp'] for x in db_data],
marker=dict(color='#2196f3'),
name = 'Dryer Temp History'
)
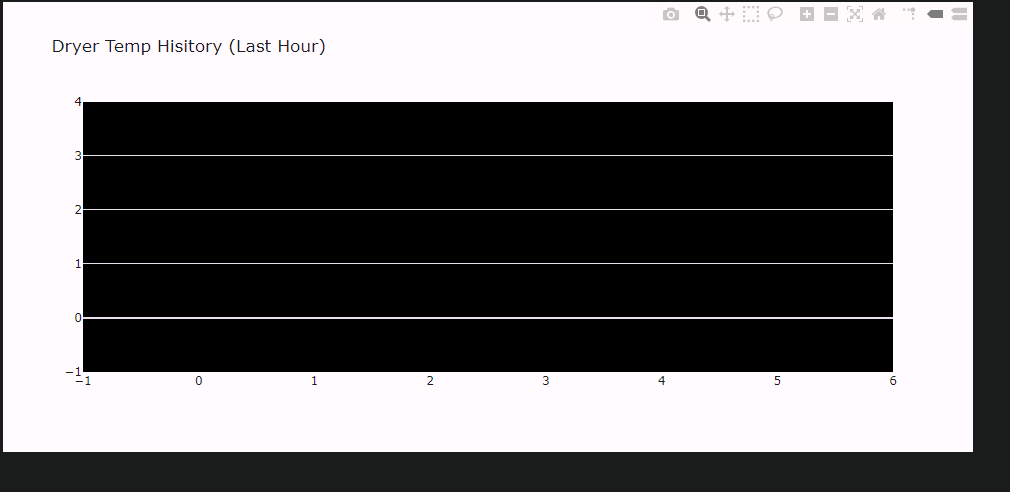
self.plot_temp_history.layout.title = "Dryer Temp Hisitory (Last Hour)"
self.plot_temp_history.layout.plot_bgcolor = "#000000"
#Plot.templates.default = "rally"
self.plot_temp_history.layout.template = "material_light"
anvil.server.SerializationError: Cannot serialize return value from function. Cannot serialize <class 'anvil.tables.v2._search.PartialSearchIter'> object at msg['response']
at Graphs, line 19
called from Graphs, line 13
called from Dashboard, line 82
I think it’s something to do with how plotly expects the data?
Thanks! I want to make this as fast as possible so it loads quickly for the dashboard. I tried your suggestions, and it didn’t like it for some reason…
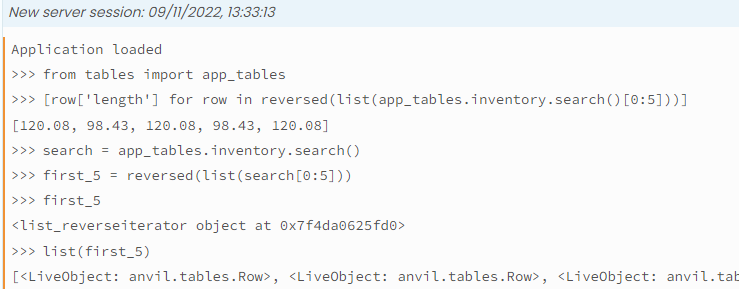
TypeError: 'PartialSearchIter' object is not reversible
at DashboardModule, line 44
called from Graphs, line 19
called from Graphs, line 13
called from Dashboard, line 82
Seems its something in how plotly is expecting the data?
  def build_TempHistory_graph(self):
        #self.plot_temp_history.data = go.Bar(y=[100,400,200,300,500])
        db_data = anvil.server.call('get_temp_history_plot')
        # Create a Bar plot with this data, and change the colour of the markers
        self.plot_temp_history.data = go.Bar(
         x = [x['timestamp'] for x in db_data],
         y = [x['Temp'] for x in db_data],
         marker=dict(color='#2196f3'),
         name = 'Dryer Temp History'
        )
        self.plot_temp_history.layout.title = "Dryer Temp Hisitory (Last Hour)"
        self.plot_temp_history.layout.plot_bgcolor = "#000000"
        #Plot.templates.default = "rally"
        self.plot_temp_history.layout.template = "material_light"
A serialization error doesn’t have anything to do with Plotly, it’s complaining that it doesn’t know how to send the partial search iterator from the server to the client. Just move the slicing to the client, e.g.:
Thanks man. I’m playing with that as an option now.
  def build_TempHistory_graph(self):
        #self.plot_temp_history.data = go.Bar(y=[100,400,200,300,500])
        db_data = anvil.server.call('get_temp_history_plot')
        db_data = db_data[0:60]
        # Create a Bar plot with this data, and change the colour of the markers
        self.plot_temp_history.data = go.Bar(
         x = [x['timestamp'] for x in db_data],
         y = [x['Temp'] for x in db_data],
         marker=dict(color='#2196f3'),
         name = 'Dryer Temp History'
        )
        self.plot_temp_history.layout.title = "Dryer Temp Hisitory (Last Hour)"
        self.plot_temp_history.layout.plot_bgcolor = "#000000"
        #Plot.templates.default = "rally"
        self.plot_temp_history.layout.template = "material_light"
Will have to play with it some more. It runs, but doesnt plot anything.
This was in the interest of efficiency, right? Converting the entire search results to a list seems like the opposite. If there are a million rows in there, that’ll take some time. Better to convert to a list (if you’re trying to avoid extra round trips on the client) after slicing.
I have the full timestamp for each row in the database. May try to make a call with time delta or something like that to see if I can just pull the data I need.
Or make another Db and have it with less data points, or just by the current day.
What you are trying to do should work. Can you share a clone link? That’ll let us play with it a bit to see where the disconnect is with the charting.
Keep in mind a clone link will share the contents of data tables, too, so if there’s anything sensitive in there you might want to create a smaller app that shows the problem.