how do you display a data table with nested columns
Do you mean that columns are visually grouped, with the group as a whole having its own, independent, column title?
Yes, for say I have 2 columns shows data for fiscal year 2019 and 2020 and they are all under the column of budget.
You could nest two data grids inside of one data grid.
Here is clone:
https://anvil.works/build#clone:TZJQ2SR5ZWPYY2YW=MILLY5JSTBSKQUQNJEIQPEX6
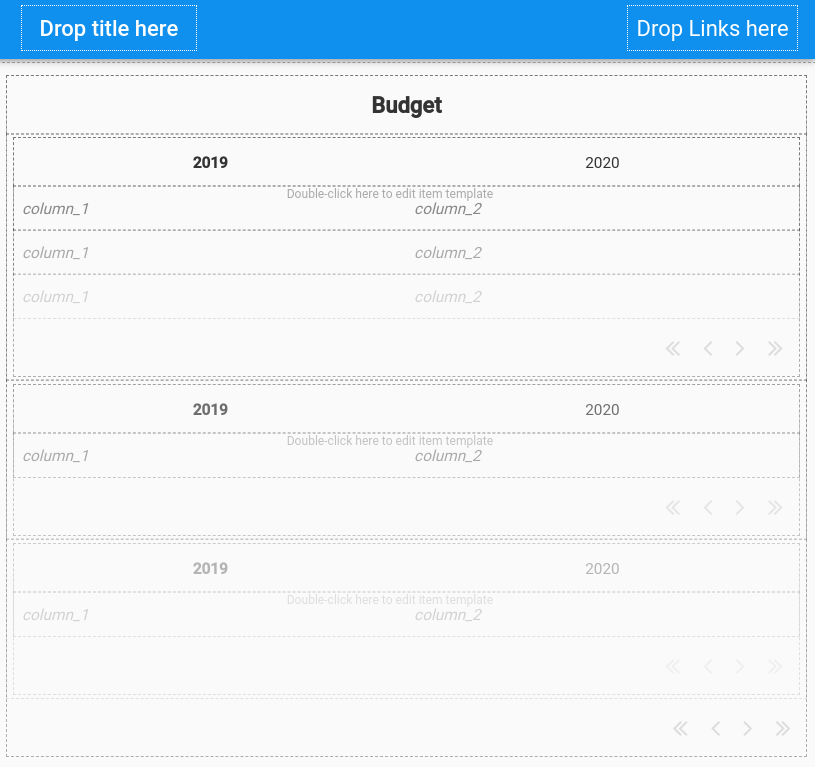
If you don’t need the outer object to be a data grid itself, you could simplify the whole thing by just using two data grids next to each other and putting a plain old label at the top of them.
Anyway, these are the things that come to mind.
Note that I like to remove the auto headers in DataGrids. I replace them with an outer DataRowPanel and that lets me add a label component which gives me more control over standard properties (e.g., alignment).