Been stuck on something for days, and I’m hoping someone can help me out.
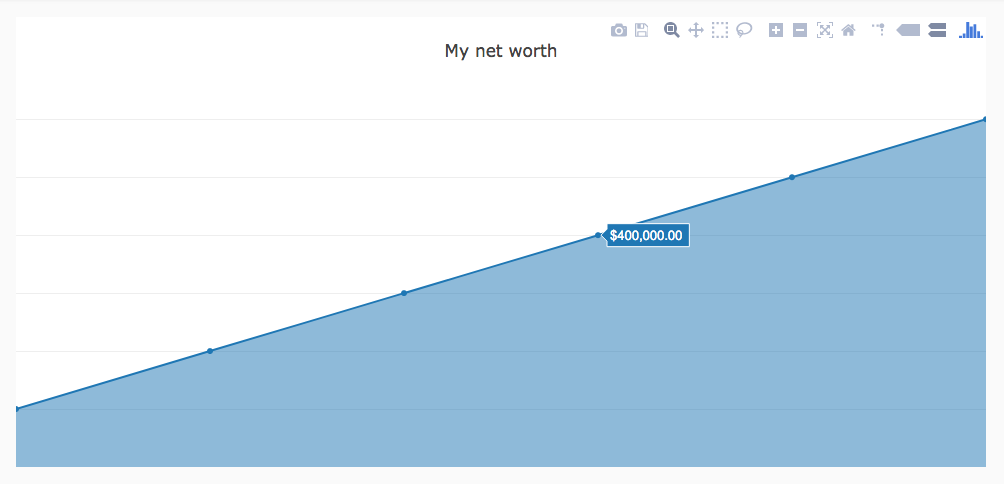
I have a chart with dates for the x axis and six figure dollar amounts for the y axis. For some reason, my chart’s hover format is defaulting to showing only the y axis, and in exponential notation. Adding the hovertemplate does no good, setting hoverformat for my x and y axis does no good. If I change hover info to ‘text’, it’ll show text, but setting it to ‘x’ or ‘y’ or ‘x+y’ just shows the y value in exponential notation.
I have tested the plotly plot in a Jupyter notebook (because re-running the app to update the chart and see if it changed takes a while) and it comes out fine there.
Hi Lee
I couldn’t find the reason why your code doesn’t work, but you can work you way around the problem by setting the hoverinfo to “text” and building yourself the hover texts.
I have modified your code this way and it works: