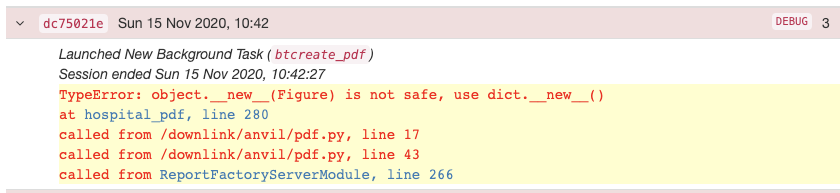
Any ideas if anything changed in the last 30 days that could cause this? I know it’s minimal information…
The call to is the offending line is " self.plot_1.figure = anvil.server.call(‘gen_historical_graph’, company_mon1tb,company_mon2tb,company_mon3tb,peer_mon1tb,peer_mon2tb,peer_mon3tb,month_range)"
    # ***************************************
    # GRAPHS/PLOTS
    # ***************************************
    # TOP GRAPH
    self.topgraph_title5.text = company_name
    print('calling gen historical graph')
    self.plot_1.figure = anvil.server.call('gen_historical_graph', company_mon1tb,company_mon2tb,company_mon3tb,peer_mon1tb,peer_mon2tb,peer_mon3tb,month_range)
    print('back from calling gen historical graph')
    self.plot_1.layout.autosize=False
    self.plot_1.interactive=False
    self.plot_1.height=210
    self.plot_1.width=950
    self.plot_1.layout.showlegend=False
    self.plot_1.layout.paper_bgcolor='rgb(255,255,255)'
    self.plot_1.layout.plot_bgcolor='rgb(255,255,255)'
    self.plot_1.layout.xaxis.showline=False
    self.plot_1.layout.yaxis.showline=False