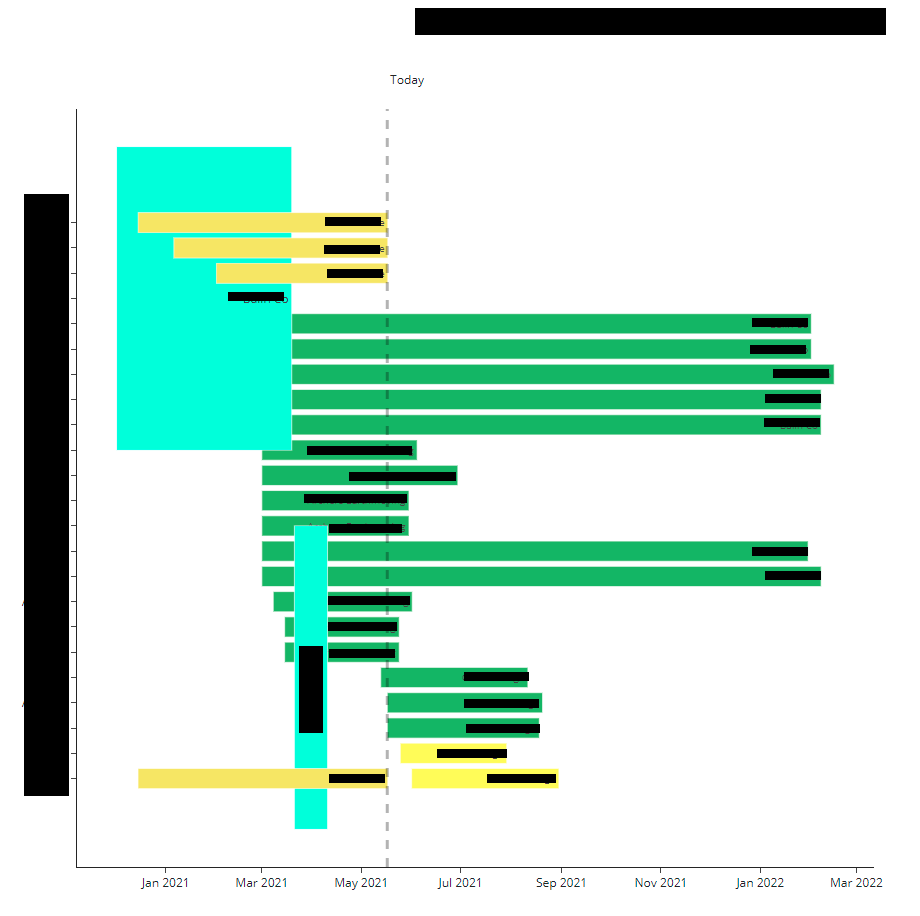
Just wondering if there has been an Anvil / plotly update as the plots that I draw on a regular basis now have some irregularities. I normally draw using plotly express.timeline but the images now show up with odd shapes. For example the traces are now odd shaped - previously all trace heights were the same - single line sized.
Black rectangles added to mask data only and not part of the issue.
Code to create the plots:
df = pd.DataFrame(list_of_dicts)

    fig = px.timeline(df,
                      x_start="Start",
                      x_end="Finish",
                      y="ID",
                      color="Status",
                      color_discrete_map = colours,
                      text = 'Client',
                      template = "simple_white",
                      height = 150 + (df['ID'].nunique()*35),
                     )
Happy to provide a clone to Anvil.
UPDATE: I have tried rolling back the version to earlier this month when I am confident this issue wasn’t present but the issue persists,