I am working on some ETL code that runs after a file gets uploaded to Anvil. The transformation process may involve several steps or tasks, that can together form a workflow. I am trying to come up with a way to write composable pipes. Ideally, I would like to expose the pipeline to the user - so that when the pipeline breaks, the user also knows which step in the transformation is failing. I have considered a number of approaches including Pandas Pipe, Fn_graphs library, Prefect, etc. I am trying to avoid any library that posts to a different dashboard/cloud console etc., so that everything is available directly in the anvil app.
This can’t be a new problem, so wondering if some of you can share your approach to solving this.
I haven’t implemented this yet. It’s still very much in the conceptual stage. Much depends on the topology of the pipeline (processing nodes and queues), and how the “unit of work” might be aggregated or subdivided for processing.
This suggests treating a “unit of work” like a FedEx package: with tracking ID, and “current” location. That means “locations” need to have IDs, too. Put these in a database table, tagged with the relevant user ID(s), and filter by that.
If a workflow splits into branches, such that a “unit of work” is divided (or duplicated) to go down multiple branches simultaneously, then there may be multiple “current” locations. In that case, it might be easiest to keep an event log, with timestamps, for units of work arriving and leaving various stops.
My research in logging led me to Eliot, which was designed for potentially complex cases like these. Whether you like and can use the library and tooling, or not, at least it has concepts and techniques which may apply.
1 Like
You might check out dagster and airflow. Not used them personally but they are very popular.
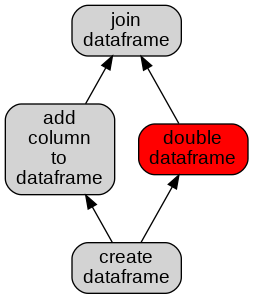
Thanks. I am looking for an approach that is contained within the Anvil app. Airflow, Luigi, etc. launch a separate UI that needs a server to be run. I don’t think Anvil supports this, and even otherwise, I am looking for something more lightweight. All I am looking for is a dependency graph and a visualization to go with it (something simple, like red nodes for failed tasks)
Here is an example using Prefect Cloud. It however requires back and forth communication with another cloud dashboard. I am trying to see if i can get a minimal version of this, within the anvil app
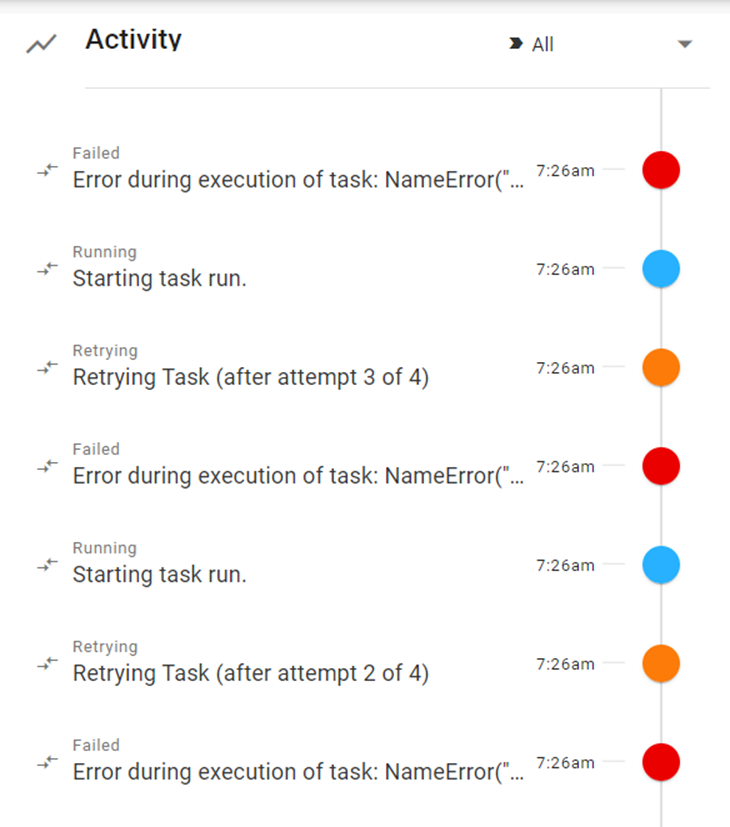
With some hack code, I have been able to get to the following inside of Anvil. Helps user to understand where his upload is failing.
One way to represent this in a database is with 2 tables: one to identify nodes (one node per row), and one to identify directed edges (one per row; from_node, to_node). Add more columns for additional data as needed (e.g., node/edge names). Row IDs can thus identify nodes and edges, i.e., places where a data packet might linger or get stuck.
1 Like