Hello,
This is apparently a known issue in the statsmodels library. The current version is not compatiple with newer versions of scipy. More info here.
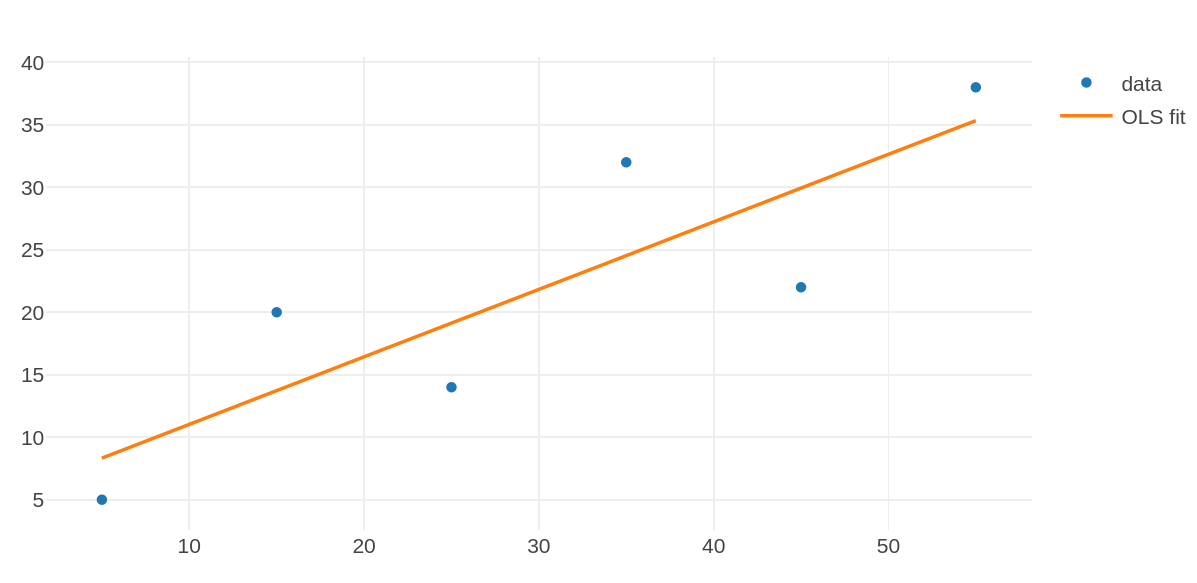
One possible workaround (and there are a few) is to use sklearn to do the model fitting and derive the OLS regression line. For example,
Server code (full Python 3)
import anvil.server
import plotly.graph_objects as go
#import statsmodels.api as sm
from sklearn.linear_model import LinearRegression
import numpy as np

@anvil.server.callable
def ols_plot():

  X=[5, 15, 25, 35, 45, 55]
  Y=[5, 20, 14, 32, 22, 38]

  x = np.array(X).reshape((-1, 1))
  y = np.array(Y)
  model = LinearRegression().fit(x, y)
  y_pred = model.predict(x)

  data = [
  go.Scatter(
    x = X,
    y = Y,
    mode='markers',
    name='data'
  ),
  go.Scatter(
    x = X,
    y = y_pred,
    mode='lines',
    name='OLS fit'
  )
]

  return data
Client code
data=anvil.server.call('ols_plot')
self.plot_1.data=data