Hi,
I am trying to get a ‘ols’ trendline in a plotly express figure , and the code which I enter into the server module is as follows :
import plotly.express as px
import scipy.misc
import statsmodels
import scipy
fig_temp = px.scatter(x=x, y=y, trendline=“ols”)
However I receive an error message as follows :
ImportError: cannot import name ‘factorial’ from ‘scipy.misc’ (/usr/local/lib/python3.7/site-packages/scipy/misc/init.py)
Earlier I would import plotly express and plot, but after seeing the error message I have tried importing scipy and scipy.misc and the rest, but still receive the same error message.
What do I do ? How can I get over this issue ? Is this an issue with my coding or the said package isnt available in the server ???
Thank You.
Regards,
Aditya Bihani.
Hello,
This is apparently a known issue in the statsmodels library. The current version is not compatiple with newer versions of scipy. More info here.
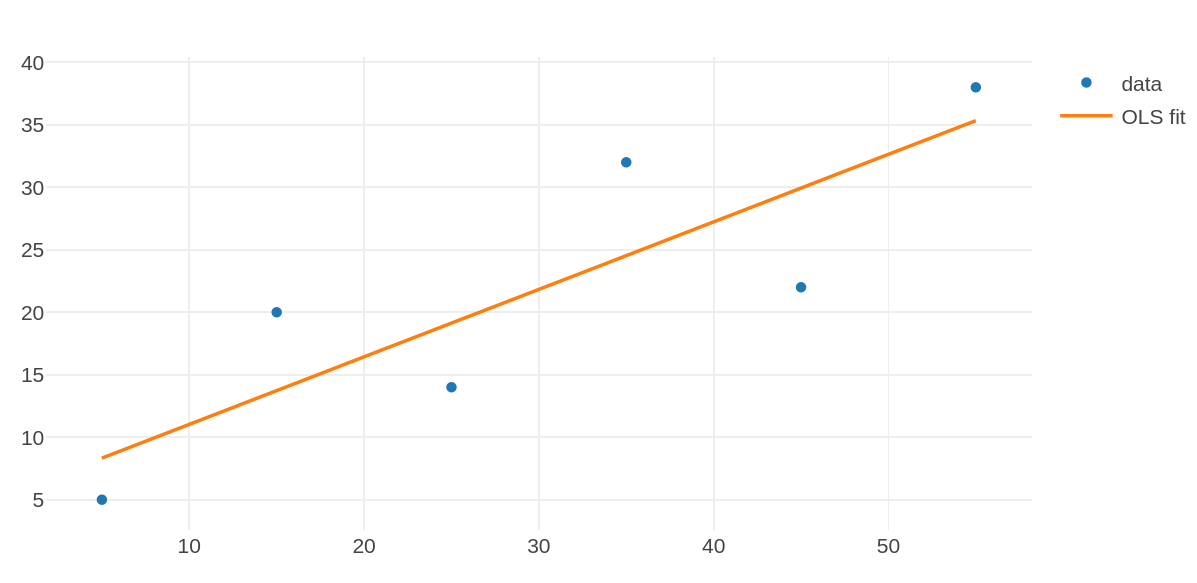
One possible workaround (and there are a few) is to use sklearn to do the model fitting and derive the OLS regression line. For example,
Server code (full Python 3)
import anvil.server
import plotly.graph_objects as go
#import statsmodels.api as sm
from sklearn.linear_model import LinearRegression
import numpy as np

@anvil.server.callable
def ols_plot():

  X=[5, 15, 25, 35, 45, 55]
  Y=[5, 20, 14, 32, 22, 38]

  x = np.array(X).reshape((-1, 1))
  y = np.array(Y)
  model = LinearRegression().fit(x, y)
  y_pred = model.predict(x)

  data = [
  go.Scatter(
    x = X,
    y = Y,
    mode='markers',
    name='data'
  ),
  go.Scatter(
    x = X,
    y = y_pred,
    mode='lines',
    name='OLS fit'
  )
]

  return data
Client code
data=anvil.server.call('ols_plot')
self.plot_1.data=data
2 Likes