Hi there,
I’m new to Anvil so please excuse if I am missing something obvious.
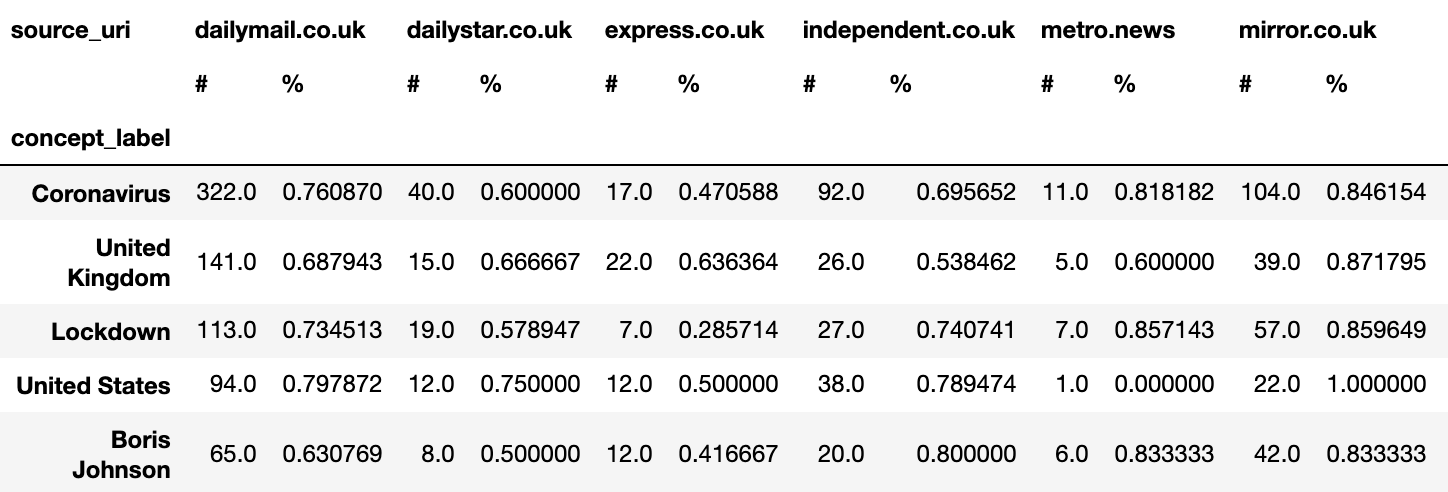
I have a Pandas dataframe that has grouped columns, showing a count number and a percentage per news article (see image below (no styling applied)).
What is the best way to show a table like that on Anvil?
Thanks,
Vincent
Hello and welcome,
Check out the DataGrid component in the documentation (and Repeating Panels).
Thanks. I read through the DataGrid info however it doesn’t explain how I could create grouped columns as described in my post. How would I do that?
Hi there. I was referring to the issue of displaying the data, not calculating/transforming it.
DataGrids are definitely the right way to go to display the data. As you have mentioned, you can use Pandas to do the transformation. Then, you could return that data back as a list of dictionaries to be used in your DataGrid.
I think there are a few pandas related posts on the forum that deal with how to display them in Anvil (this involves converting the Pandas DataFrame to something that can be passed back to the client and bound to your DataTable (e.g., a list of dictionaries).
Have a look at the other forum posts on Pandas to see if that helps to clarify a bit more. I’ll try to post some links here if I can find some free time.
The displaying of the data is also what I’m struggling with. I converted the Pandas dataframe to a dict and the first 2 grouped columns would look like this:
{('dailymail.co.uk', '#'): {'Coronavirus': 322.0,
  'United Kingdom': 141.0,
  'Lockdown': 113.0,
  'United States': 94.0,
  'Boris Johnson': 65.0,
  'Donald Trump': 80.0,
  'Minneapolis': 74.0,
  'Twitter': 78.0,
  'Pandemic': 74.0,
  'Virus': 68.0},
 ('dailymail.co.uk', '%'): {'Coronavirus': 0.7608695652173914,
  'United Kingdom': 0.6879432624113475,
  'Lockdown': 0.7345132743362832,
  'United States': 0.7978723404255319,
  'Boris Johnson': 0.6307692307692307,
  'Donald Trump': 0.7875,
  'Minneapolis': 0.9594594594594594,
  'Twitter': 0.8076923076923077,
  'Pandemic': 0.8513513513513513,
  'Virus': 0.7794117647058824}
Looking at the docs, this would show as two entirely separate columns though, not two columns grouped under the same header (dailymail.co.uk in this case). Or would this not even work in the DataGrid?
I would suggest trying to convert your dataframe to a list of dictionaries (orient=‘records’ I believe - check pandas to_dict docs). See if you can make some progress with that and check out the other Pandas related posts on the forum that deal with displaying of dataframes.