Hi,
I’m trying to display a time series (via matplotlib) into Anvil. The time series gets appended to with additional samples within a loop. My Anvil app runs OK but the plot(image) isn’t displayed. The Uplink checks out OK and the plot appears Ok within the notebook as it gets updated through the loop.
My code is below:
import anvil.server
anvil.server.connect("mycodehere")

import requests
import json
import pandas as pd
import numpy as np
import matplotlib.pyplot as plt
import time
from IPython.core.display import display, HTML
import pylab as pl
from IPython import display
from mycbr_py_api import MyCBRRestApi as mycbr
import anvil.media
import anvil.mpl_util

# enable REST API
cbr = mycbr(base_url='http://localhost:8081')

def add_new_attribute( name, value, case=None):
    if case == None:
        case = dict()
    case.update({name:value})
    return case

def cbr_retrieval(query_case, global_sim="well_data_sim_float", k=-1):

    url = "http://localhost:8081/concepts/well_data_row/casebases/cb/amalgamationFunctions/"+ global_sim +"/retrievalByMultipleAttributes?k="+(k).__str__()

    payload = query_case
    response = requests.post( url=url, json=payload)
    result = pd.DataFrame(response.json(), index=[0]).T
    result.columns = ['similarity']
    return result

# plot time series in notebook and also send image to anvil

def plot_time_series():

    temp_y=df_csv[attribute_name].tolist()
    xlist.append(i*100)
    ylist.append(temp_y)
    display.clear_output(wait=True)
    plt.figure(figsize=(8,4))
    plt.xlabel("Depth (ft)")
    plt.ylabel("Pressure (psi)")
    plt.plot(xlist, ylist, marker= 'o', markerfacecolor='blue',markersize=5)
    plt.title('Real Time Pressure Data')
    # plot within notebook
    plt.show()
    # send plot to anvil
    return anvil.mpl_util.plot_image()

# input csv file to be read into mycbr

df_csv = pd.read_csv('new_drill_1.csv')

# mycbr 'attribute list'

attribute_list = ['depth_100', 'depth_200', 'depth_300', 'depth_400', 'depth_500',
                   'depth_600', 'depth_700', 'depth_800', 'depth_900', 'depth_1000',
                   'depth_1100', 'depth_1200', 'depth_1300', 'depth_1400', 'depth_1500',
                   'depth_1600', 'depth_1700', 'depth_1800', 'depth_1900', 'depth_2000']

@anvil.server.callable
def make_plot():
    query_case = {}

    # had to add line below to get this loop to run
    # selects the first casebase ID (cb) in the project

cbr._setCurrentCasebaseID( casebaseID=cbr.getCaseBaseIDs()[0])

result = pd.DataFrame()

# loop to read from case base, perform CBR and plot incoming time series and drilling 'advice' from case base

xlist=list()
ylist=list()

for i, attribute_name in enumerate(attribute_list):

    # simulate real time data acquistion with delay

    time.sleep(1.0)

    query_case = add_new_attribute( attribute_name, df_csv[attribute_name].tolist()[0], query_case)

    # plot time series in notebook

    plot_time_series()

    # retrieve from casebase

    result = cbr_retrieval( query_case)

        # highest similarity

    top_caseID = result.index.tolist()[0]

        # set top_case to higher similarity case

    top_case = cbr.getCaseByCaseID( caseID=top_caseID)

        # select drilling advice (decision) from case base

    current_decision = top_case.decision.tolist()[0]

        #print output and drilling advice
    print("MD Depth : " , (i+1)*100,"ft  ", "Pore Pressure : " , df_csv[attribute_name].tolist(), "psi",  "-----  Current Advice is : ", current_decision, '\n\n')
Here is my Anvil code
from ._anvil_designer import Form1Template
from anvil import *
import plotly.graph_objects as go
import anvil.server
import anvil.tables as tables
import anvil.tables.query as q
from anvil.tables import app_tables

class Form1(Form1Template):

  def __init__(self, **properties):
    # Set Form properties and Data Bindings.
    self.init_components(**properties)

    media_obj = anvil.server.call('make_plot')
    self.image_2.source = media_obj
    self.download_link.url = media_obj
If I include the last line self.download_link.url
I get the follwing error:
AttributeError: ‘Form1’ object has no attribute ‘download_link’
at Form1, line 17
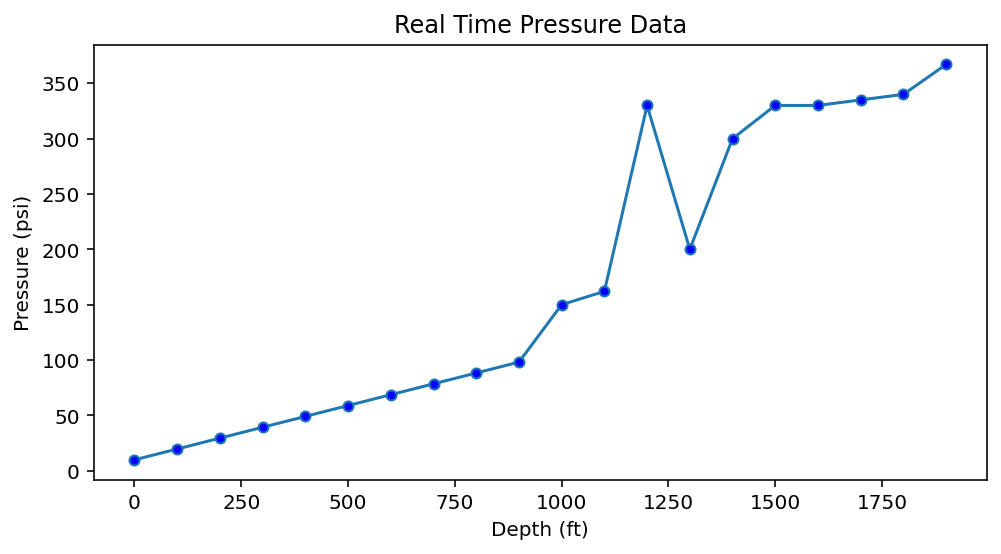
and here’s the plot within my notebook: