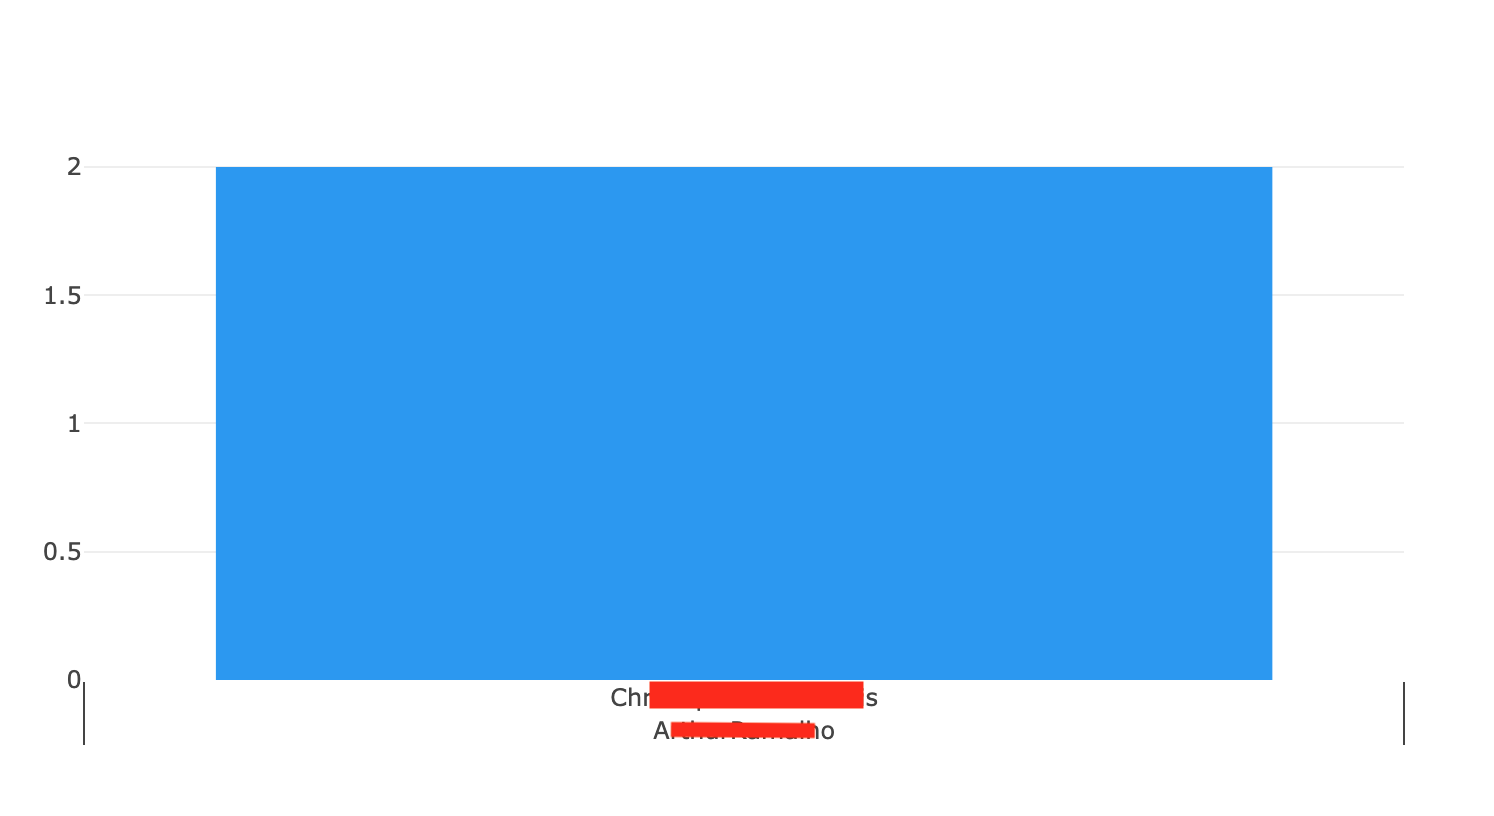
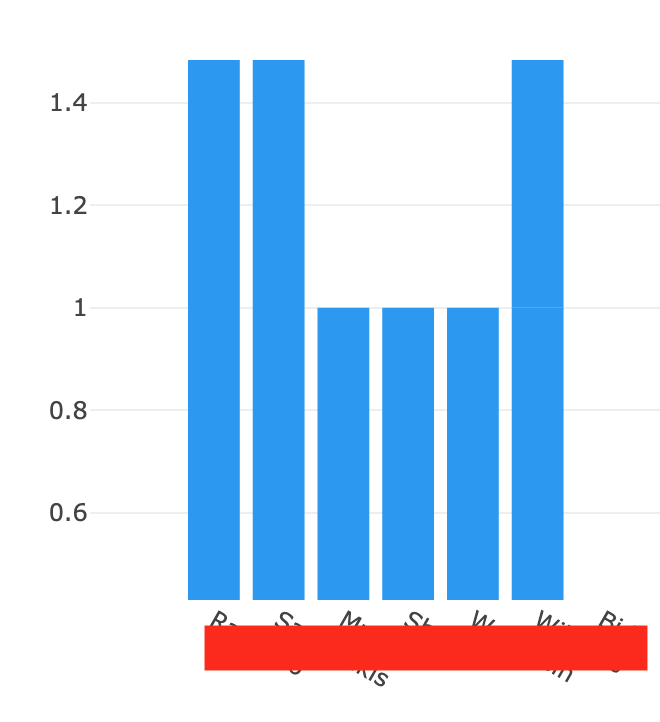
I have a bar graph that showing lap_count and last_name. Is there a way to format the my X axis to show their first and last name …it’s currently two columns in my data table?
self.plot_1.data = go.Bar(
  x = [x['last_name'] for x in db_data],
  y = [x['lap_count'] for x in db_data],
  marker=dict(color='#2196f3')
)
I tried this …but it ended up screwing up the whole data plot!
self.plot_1.data = go.Bar(
x = [[x[‘first_name’], x[‘last_name’]] for x in db_data],
y = [x[‘lap_count’] for x in db_data],
marker=dict(color=’#2196f3’)
)
You can combine strings using multiple methods in python. One way is to use the + operator, or you could use string formatting and pass the two columns as parameters.
You may want to join the pair together into a new list, with some kind of separator (a space) and use that for your X axis labels. There are lots of ways to do this (e.g., f strings, join(), string concatenation, format()).
One example:
data=[{'first':'jim', 'last':'slim'}, {'first':'bob', 'last':'builder'}, {'first':'joan', 'last':'baez'}]

full_names=['{0} {1}'.format(row['first'], row['last']) for row in data]

# full_names is:
['jim slim', 'bob builder', 'joan baez']
I second that adding a full_name key/value is the way to go here. Assuming you have a list of dicts this might work:
# make new key/value pair for ever item in your data
for x in db_data:
    x['fullname'] = x['first_name'] + ' ' + x['last_name']

self.plot_1.data = go.Bar(
    x = [x['fullname'] for x in db_data],
    y = [x['lap_count'] for x in db_data],
    marker=dict(color='#2196f3')
)
@alcampopiano’s approach is more in line with your list comprehensions. Mine might be better if you want to reuse this data again and filter it without worrying about alignment.