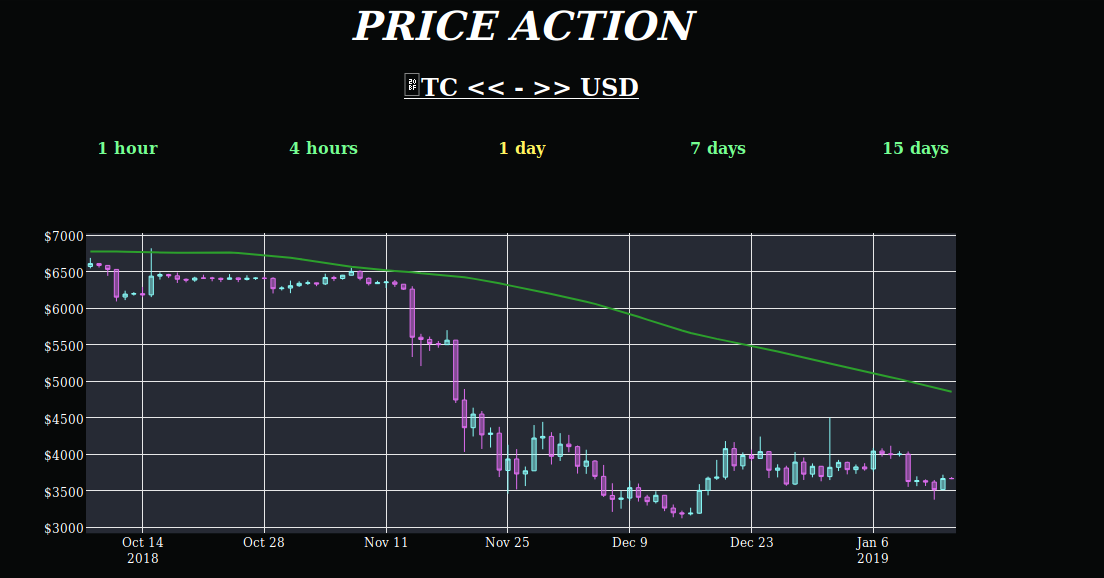
I made a BTC price chart using the anvil plot tools and the kraken API. Anyone have any suggestions for what to add next?
UPDATE: added a page for scheduling consulting sessions and leaving donations either in dollars or BTC.
All this was done in a 2 day period and I am barely a junior league python developer.
3 Likes
That is slick- very nicely done. I suppose you could add some technicals like moving average, but I kind of like the uncluttered look.
1 Like
that’s a good idea. look at it now. I added a 100 period moving average which starts 100 periods before the first candlestick. With these charts I am trying to show the longer term trend at these different time frames.
1 Like
Looks nice.
One small glitch on latest Firefox (Ubuntu) - look at the first characted of the sub-heading :
it looks like the fonts I used, Futura and Courier , did not persist. I changed that title in the time since you posted, so it may look better.
You could add the option to have a logarithmic scale option along with the linear one on the y axis,
A toggle would be nice. I made the 7 day and 15 day logarithmic by default