What I’m trying to do:
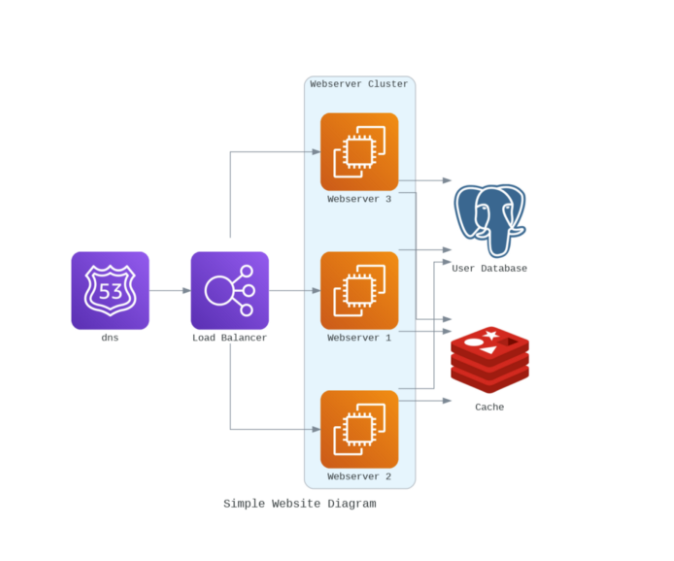
Hi! I want to create a block diagram as a figure in Anvil based on data in a data table. Something like this would be fantastic:
What I’ve tried and what’s not working:
I’ve tried using ‘diagrams’ per this tutorial (https://towardsdatascience.com/create-beautiful-architecture-diagrams-with-python-7792a1485f97), which seems to be loading in my server module. However when I run any part of it, I get the error: FileNotFoundError: [Errno 2] No such file or directory: ‘xdg-open’: ‘xdg-open’
Is there any way to get this module working? If not, are there any better ways of getting a block diagram to generate in Anvil?
Hi @andrewsnark!
According to its docs, the diagrams module will by default automatically open the diagram it’s created with your system file viewer. (xdg-open is a program that chooses the best app to open something with on desktop Linux.)
Now, your server code is running on the Anvil servers, which don’t have any graphical display, so you can’t open a file viewer! According to the diagrams docs, you can disable this behaviour with show=False. Then you just have to get the local image file it’s written (usually a .png) back to the client to display. The easiest way to do this is to use anvil.media.from_file() to load that file into a Media object, which you can then return from a server function and use as the source of an Image component.
4 Likes
Problem Solved-
Thanks that was exactly the issue!
Great! If this solved your problem, please click the “Solution” button to mark it as solved!