The visual form editor seems to get slower over time, so I find I have to refresh the tab every so often. Problem is it’s taking longer and longer for the IDE to refresh.
The screenshot below was after about 5 minutes. Sometimes it’s faster (about 2 mins) and once or twice I went away for a while and came back to no change. Not sure how long I was away for but I’d say upwards of 10 minutes.
What data can I get for you to help diagnose this? I am on Ubuntu 20.4, FF 93.0 (64-bit). Chrome is the same (though I don’t use it very often).
It seems to be project independent. It even happens when firing up the IDE with no project.
Seeing similar behavior - although not that severe (about 2 minutes loading time).
I also feel (have not tested it in any “scientific” way) that the more projects i have open and the more people working on a certain project the slower it gets.
I’m the only dev. and I only have one tab open. The projects are not very big (no media at all). Some do have anvil-extras loaded but some don’t. I can’t find any common ground between them.
Hopefully next week Anvil Central can advise on what data they need from me to help diagnose this. It’s probably my set up, but not sure how or why.
(I have 4 tabs open - Anvil-Editor, Anvil Forum, Trello, and Google Firestore)
Although i have no problems upgrading my ram this seems a bit excessive.
I’ve had instances over 6gb after a good day of working with the anvil editor.
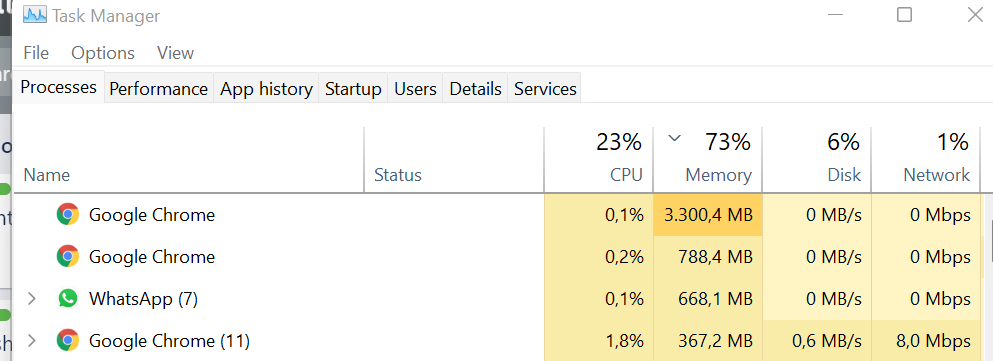
Yeah, the problem is definitely RAM. When my IDE gets slow I always check the Chrome internal Task Manager where you can see process data for individual tabs and plugins. Usually Anvil get to around 2GB of Memory + almost 1GB of GPU Process (that’s mostly used by Anvil). I only use 1 tab of Anvil at the same time. Refreshing the tab does not fix the problem to me. The only fix seems to kill both processes and then reload the page.
It appears that Anvil is creating recurrent process and not killing previous ones, which makes the page constant grow in memory usage over time. I had this with other projects (not Anvil related) and it was due to a event handler being added multiple times in a method other then the init method of the page. When something fired the event, 4 or 8 handlers were active at the same time and this would always increase geometrically.
Also, I also have 64GB of RAM, so memory is not the problem, but I think Chrome has a limitation of it can do with those huge impact pages. Nevertheless, this is a noticeable problem that I seen reported at least 3 times and should be considered an import problem to fix.