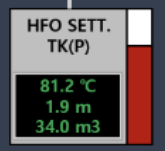
Hi,
I try to make an indicator to show a level of tank filling. ( the red bar in the picture)
I thought a bar graph may be a solution to it.
However, when I plot a graph, it doesn’t fit in the plot window.
Any recommendations, please.
Hi,
I try to make an indicator to show a level of tank filling. ( the red bar in the picture)
I thought a bar graph may be a solution to it.
However, when I plot a graph, it doesn’t fit in the plot window.
Any recommendations, please.
I made a progress bar custom component that may help (it’s based on a bar graph!):
There is also another nice progress bar on the forum as well from @david.wylie:
Nice job~~
Thank you very much~!!