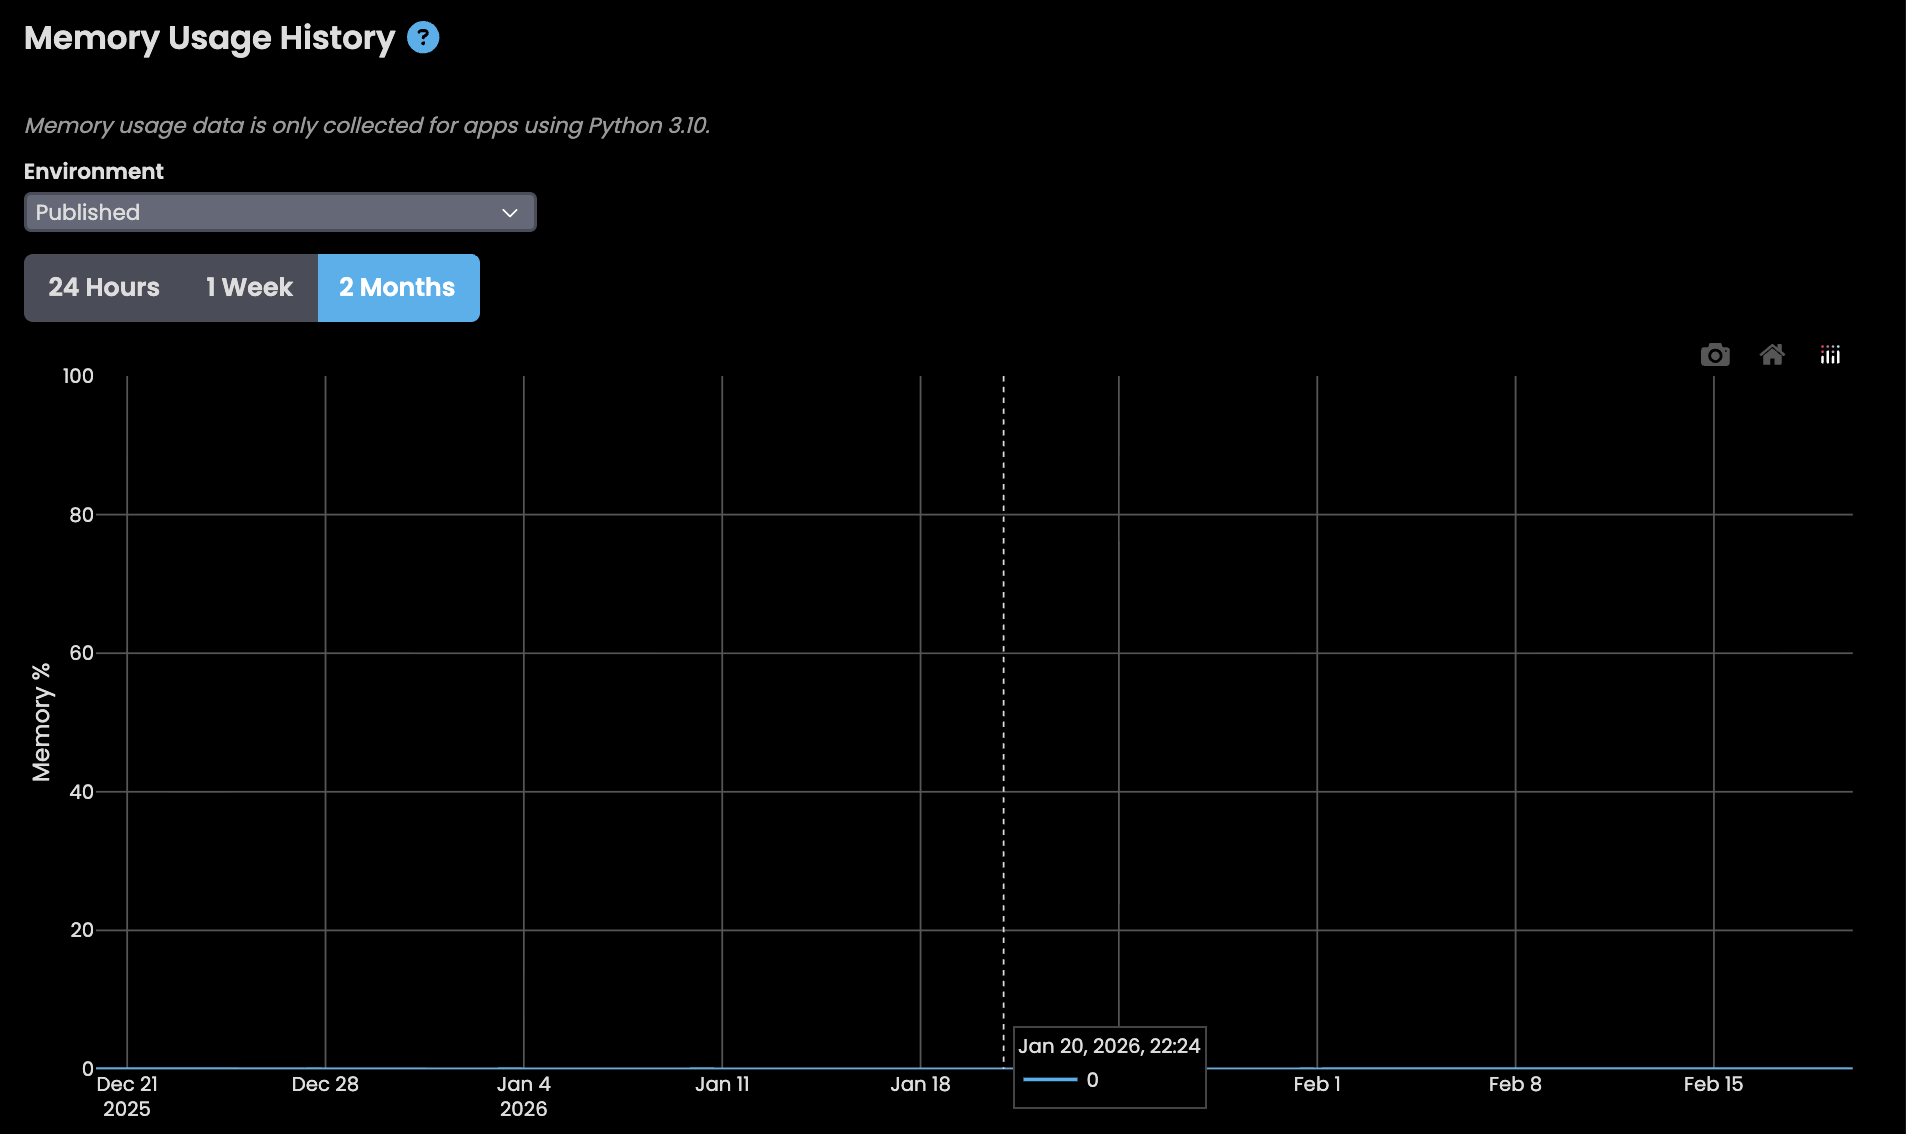
I have 10+ apps and when I go to the App Logs tab and then the Memory Usage section it shows 0% memory for the last 2 months. Is it possible that this functionality is broken for my account?
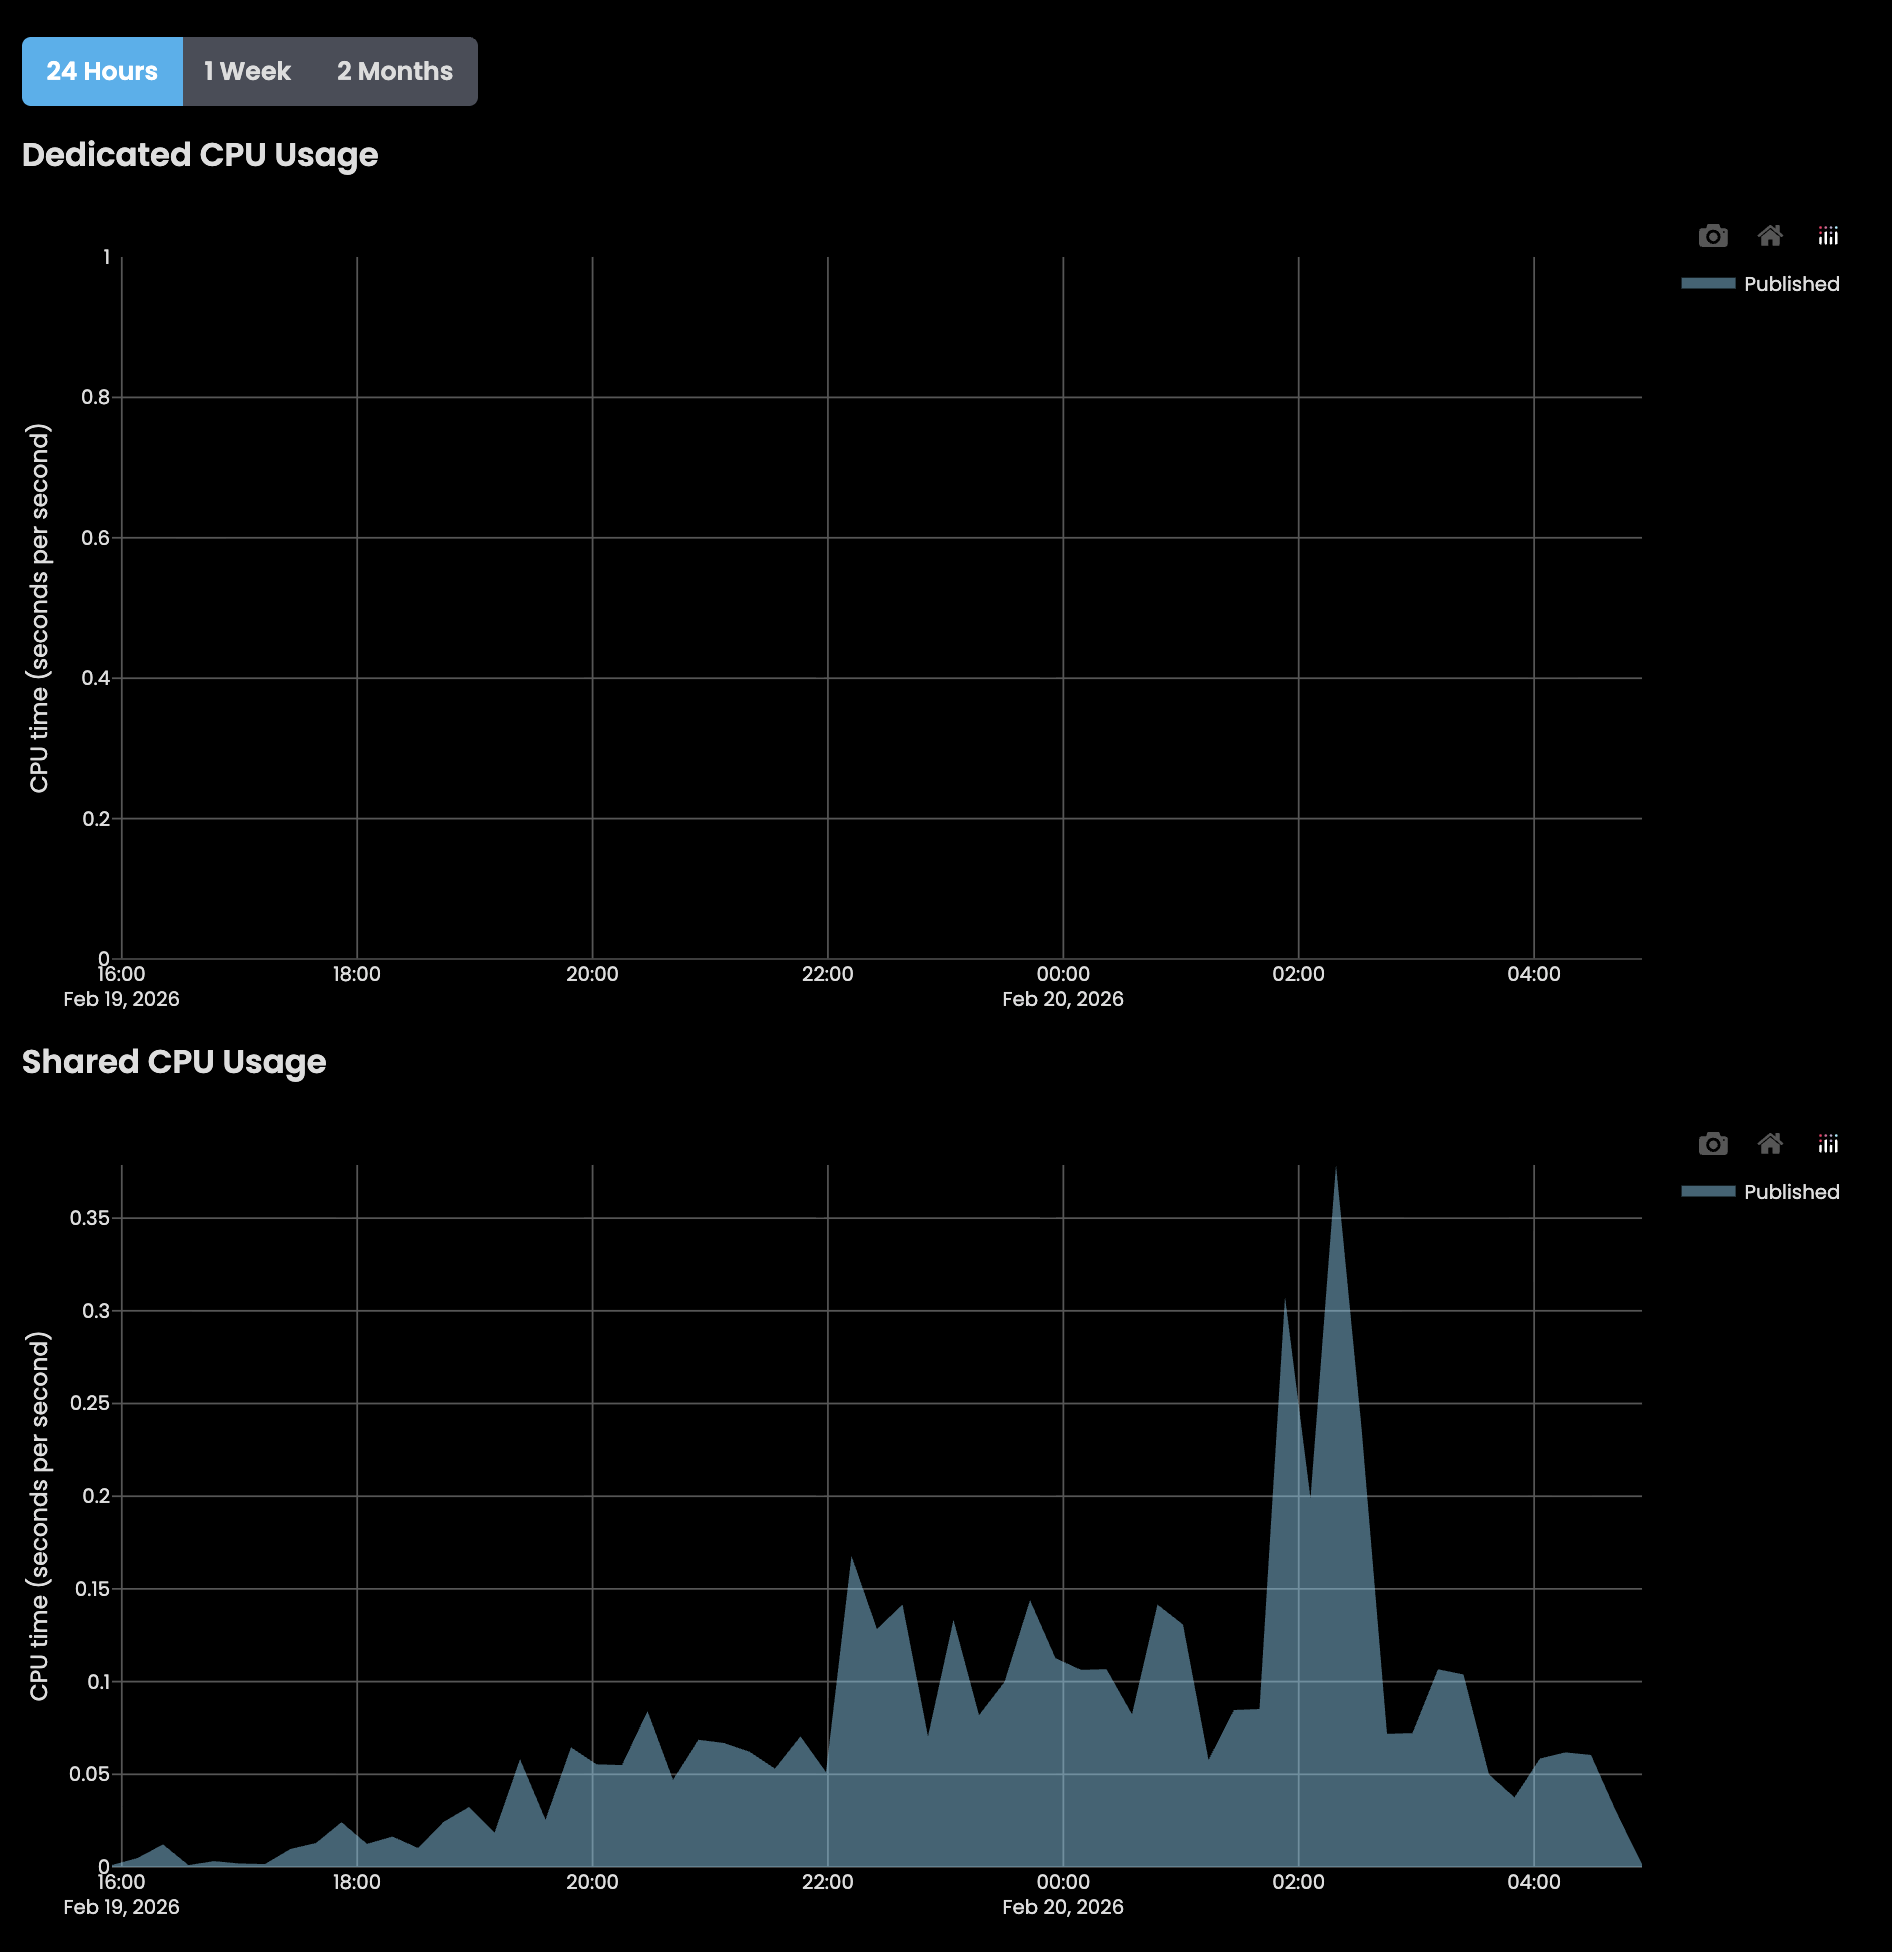
We also pay for a dedicated server, however, on the CPU Usage section of the App Logs tab it shows some usage in the Shared CPU Usage graph but no data in the dedicated CPU usage graph. Does this indicate we’re still on a shared server? We’ve had issues with our dedicated server in the past and weren’t properly setup so it might be related.
Thanks in advance.
Hi @jay.austin,
To answer both halves of this:
-
Those graphs don’t currently show usage in the legacy “Full Python 3” server environment. There are lots of other good reasons to upgrade to the newer Python 3.10 environment (you can pip install any package you like, for one!) – once you do that, your usage should start showing up here 
-
Although you do indeed have an Extra Server Resources plan, that doesn’t mean you’re running on dedicated infrastructure. Although your Server Modules and Data Tables run on your own AWS instance, your apps still use our shared API router, source code storage, etc. That graph you’re seeing is measuring usage of those shared resources.
(If you want to run on 100% dedicated infrastructure, talk to us about Anvil Enterprise. This gives you your own Anvil instance that runs entirely separate from anvil.works, anywhere in the world – whether that’s in your own datacentre or a managed instance in the cloud!)
I hope that clarifies what’s going on here – let me know if not!