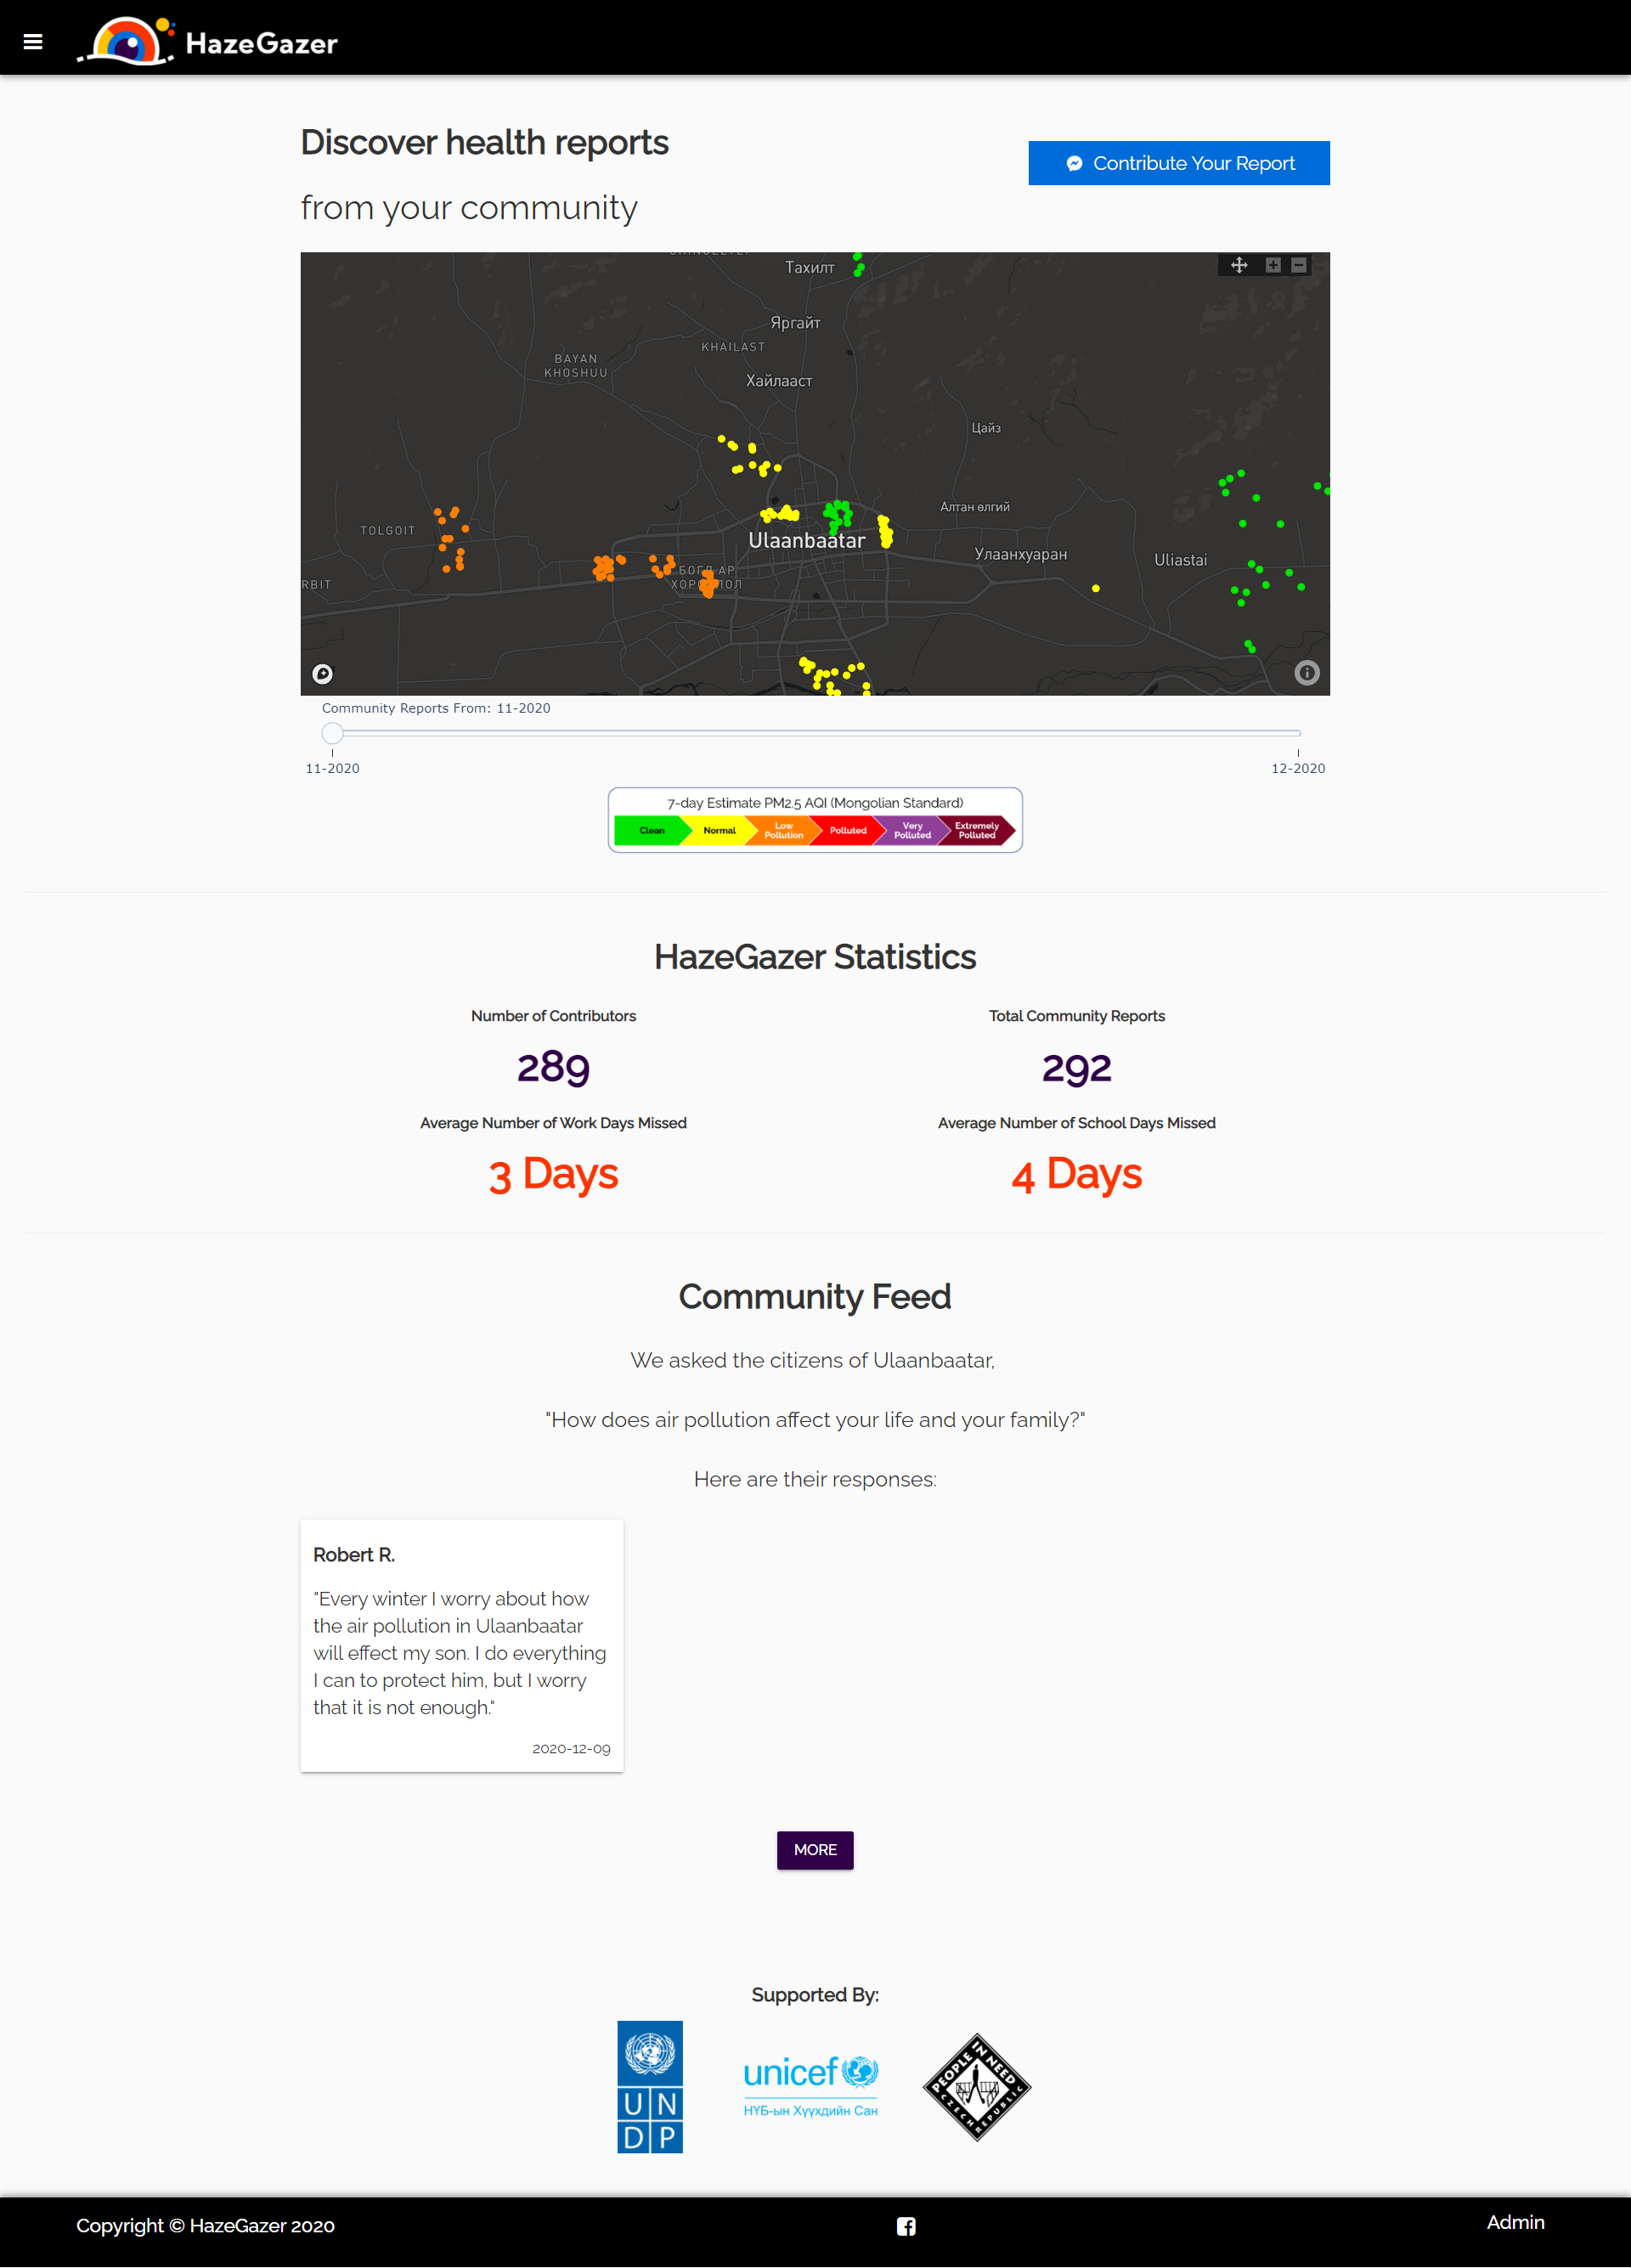
Over the past month, we’ve been hard at work making HazeGazer, a platform to allow the community to share their voice about air pollution in Ulaanbaatar, Mongolia. The web app allows users to submit health reports and their open comments regarding air pollution via a chatbot that connects to the platform via API’s. The official launch was the end of last week and we hope to get users from this week!
Data is then made available in an anonymous way (both with the person’s data and location) both on the map/community feed and as a data download. My hope is to also allow the app to be cloned (with fake data in the data tables) and have the app on Github for anyone interested.
Here were the main pieces of building the app:
-
Wrangling pollution data in an external database to ensure it is properly formatted. Luckily this was mostly done by me in prior projects: Mongolia air quality monitoring app
-
Building a Gaussian Regression model to estimate air quality all around the city, even if air quality monitors are not nearby. This isn’t perfect but it gives us a data point to be able to correlate these reports with air quality at a neighborhood level.
-
Building the survey and API’s that will ingest the data, including a method of connecting users across surveys. The survey was built using a local chatbot provider and is on Facebook Messenger. The API’s are made via Anvil’s API’s methods. This took a good amount of time not for technical reasons but human ones. We needed a good survey that would give us good data, and this is where a social science background comes in handy! The survey is also primarily text-based so it works with those mobile operators providing free text-only Facebook via internet.org.
-
Displaying the data in a visual way on a map. We originally wanted a pollution heatmap (really a contour plot) on the map. My partner made a custom map using a mixture of Folium, JS, and the geojsoncontour package. We scrapped this approach after it became our primary time sink and took away from the primary purpose of the map, community reports! So we opted to use Plotly and its Mapbox integration to build the color-coded map with detailed hover data. The whole code for plotting is about 300 lines of code! We make this map each day and store it as JSON in the data table to speed up processing.
-
There is also an admin dashboard to allow the NGO that commissioned the web app to manage the feed comments, adjust page content, see API documentation, and edit users.
-
The app is hosted in Mongolia using Anvil’s open source App Server. There were some hiccups to get it deployed, mostly due to my ignorance of the App Server.
Our key challenges:
-
Design. We had a design team make graphics for the site, but we had to scrap some of them because of a late change in our app structure due to a lack of data. Anvil made this change easy though.
-
Migrating from the Anvil cloud to the App Server. We designed the entire app around data tables. This is amazing in the Anvil cloud and they are very very easy to work with once you get the hang of it. But moving to the App Server data tables was quite confusing. My recommendation for those making an Anvil app for deployment outside Anvil’s cloud is to design the app with an external database already set up, as this will save headaches later.
-
Home page load speed. I realize why this is, but this experience left me craving for something like Memcached for Anvil (apparently there is a Python interface for a Memcached server). Of course, the app would have to be designed to use a cache system and have a built in expiration methodology, but this would help scale Anvil apps incredibly. For example, Memcached allows my Moodle instance (an open-source learning management system) for my university to scale to hundreds of concurrent users on a server with 2 vCPUs and 4GB of RAM. It also allows pages to load really fast (1-2 seconds) even with lots of dynamic content (like randomly generated exams, images, files, etc.). As it is 4-5 second load times aren’t bad, but when making apps for the public every second counts.