Hello can be possible to chart like this on Anvil: Delay | Chart.js
I try to make it but i have diffucult to undeartand how to pass data on it from datatable, any help can be grat, Thank you!
Hello can be possible to chart like this on Anvil: Delay | Chart.js
I try to make it but i have diffucult to undeartand how to pass data on it from datatable, any help can be grat, Thank you!
Anvil’s Javascript bridge makes it easy to integrate most Javascript libraries. The basic technique is that Javascript is exposed to Python through the anvil.js module. Anything you would normally do through Javascript, you do through anvil.js.
All of what follows is in the docs and the forums, but mostly not in a step by step format, so I’ll also include the step by step for ChartJS.
Integrating most Javascript libraries involves a few steps.
<script src="https://cdn.jsdelivr.net/npm/chart.js@3.9.1/dist/chart.min.js"></script>
const myChart = new Chart
That tells you there’s a Javascript object named Chart. To use that from Python, you have to import it, e.g.:
from anvil.js.window import Chart
ctx = js.get_dom_node(self.canvas_1)
*Javascript true must be changed to Python True
*Javascript objects must be written as Python dictionaries, which means the keys must be strings.
*Javascript syntax is converted to Python syntax (e.g. remove semicolons, etc)
Here’s the ChartJS example converted to Python:
        ctx = js.get_dom_node(self.canvas_1)
        self.chart = Chart(ctx, {
            'type': 'bar',
            'data': {
                'labels': ['Red', 'Blue', 'Yellow', 'Green', 'Purple', 'Orange'],
                'datasets': [{
                    'label': '# of Votes',
                    'data': [12, 19, 3, 5, 2, 3],
                    'backgroundColor': [
                        'rgba(255, 99, 132, 0.2)',
                        'rgba(54, 162, 235, 0.2)',
                        'rgba(255, 206, 86, 0.2)',
                        'rgba(75, 192, 192, 0.2)',
                        'rgba(153, 102, 255, 0.2)',
                        'rgba(255, 159, 64, 0.2)'
                    ],
                    'borderColor': [
                        'rgba(255, 99, 132, 1)',
                        'rgba(54, 162, 235, 1)',
                        'rgba(255, 206, 86, 1)',
                        'rgba(75, 192, 192, 1)',
                        'rgba(153, 102, 255, 1)',
                        'rgba(255, 159, 64, 1)'
                    ],
                    'borderWidth': 1
                }]
            },
            'options': {
                'scales': {
                    'y': {
                        'beginAtZero': True
                    }
                }
            }
        })
If you put all that together you should see the ChartJS chart being drawn on the Anvil canvas object. Since the chart is drawn based on the dictionary information passed to it, you can fill that dictionary from anywhere, including a data table.
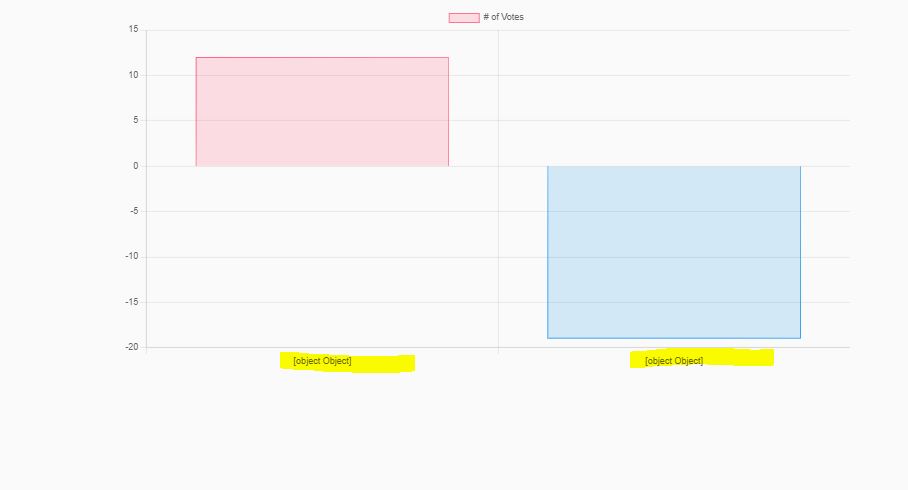
Hello, thank you so much this are help a lot to undearstand i try to dollow your steps and is work, now im tring to put in X the date of datatable and i add some other line of js under your script and when i run i not have any error but date is not showing properly, return [object Object]
Blockquote
time= app_tables.price.search()
result = [
{
‘TIME’: row[“TIME”],
}
for row in app_tables.price.search()
]
ctx = js.get_dom_node(self.canvas_1)
self.chart = Chart(ctx, {
        'type': 'bar',
        'data': {
            'labels': result,
            'datasets': [{
                'label': '# of Votes',
                'data': [12, -19],
                'backgroundColor': [
                    'rgba(255, 99, 132, 0.2)',
                    'rgba(54, 162, 235, 0.2)',
                    'rgba(255, 206, 86, 0.2)',
                    'rgba(75, 192, 192, 0.2)',
                    'rgba(153, 102, 255, 0.2)',
                    'rgba(255, 159, 64, 0.2)'
                ],
                'borderColor': [
                    'rgba(255, 99, 132, 1)',
                    'rgba(54, 162, 235, 1)',
                    'rgba(255, 206, 86, 1)',
                    'rgba(75, 192, 192, 1)',
                    'rgba(153, 102, 255, 1)',
                    'rgba(255, 159, 64, 1)'
                ],
                'borderWidth': 1
            }]
        },
        'options': {
        'scales': {
          'xAxes': [ {
            'display': True,
            'type': 'time',
              'time': {
                'parser': '%b %d %Y %I:%M %p',
                  #'tooltipFormat': 'll HH:mm',
                  'unit': 'day',
                  'unitStepSize': 1,
                  'displayFormats': {
            'day': '%b %d %Y %I:%M %p'
          }
        }
      }
    ]                    }
            }
        #}
    })
Blockquote
The original labels entry was a list of strings. You’re now passing it a list of dictionaries. That obviously doesn’t work.
It make sanse,thank you infinitly! ![]()
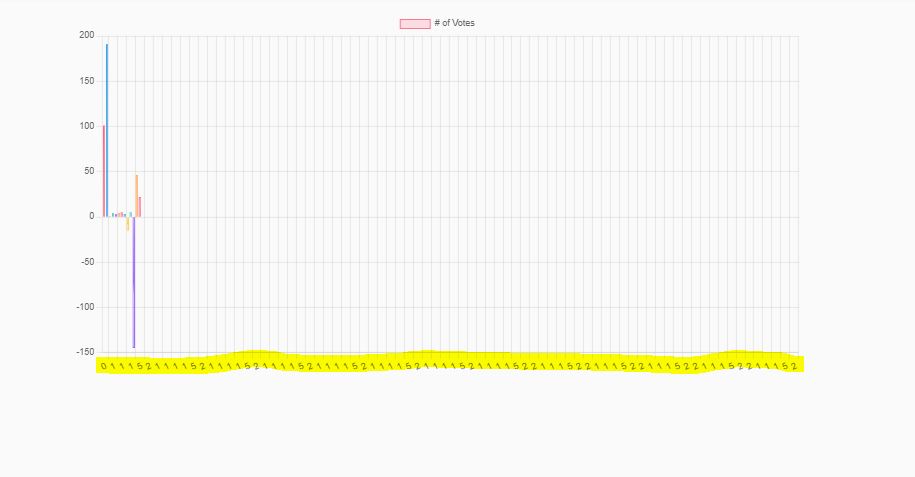
Helllo, hope you are well @jshaffstall i success to put the date but i have some issue to show properly the date on chart, right now seem like this:Anvil | Login
My objective is to display date using your tools about zone time component togher with chart js
i dont find a lot of documentation about how to manipulate the js in this way.
Thank you!
You’ve got a bad import of momentjs. I don’t know what you’re using that for, but it’s breaking things.
In general, though, you still have the same problem you had before. You’re not giving a list of strings to the labels property: 'labels': (moment.stringd.format('%d/%m/%y %H:%M:%S')),
If you want the labels to be adjusted for the timezone, pull the times from the data table and then adjust them to the user’s time zone using datevariable.astimezone(anvil.tz.tzlocal()), and then convert that to a string in a list of strings. All that is going to be done in Python.
Thank you so much! ![]()
![]()
![]()
Hello @jshaffstall, hope you are fine i try to add :
def timer_1_tick(self, **event_args):
d=[r[‘Time’] for r in app_tables.realtime.search()]
p=[r[‘Final’] for r in app_tables.realtime.search()]
D1 = d.astimezone(anvil.tz.tzlocal())
but is return this error:
AttributeError: ‘list’ object has no attribute ‘astimezone’
i add on the same form this component self.local_tz_label_1
Is this the good way to do it?
Thank you!
The error message tells you the problem. You are calling astimezone on a list. It should be called on a datetime. You must call it on every datetime in your list, not on the list itself.