Interesting. My two cents having thought about it for a second:
In terms of the visualization itself (not the backend dealings with the DataTables), I might consider approaching this by making a chart, rather than using a DataGrid/table-based visualization.
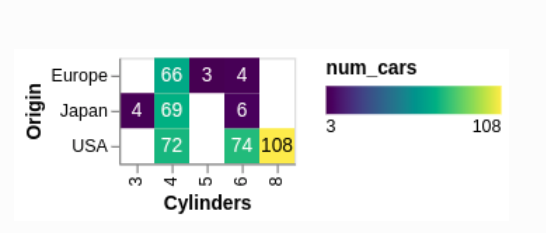
For example, your second screenshot, looks like a heat map. More specifically,
- the y axis represents operatives (some nominal value)
- the x axis represents time (some temporal value)
- the projects blocks are encoded as nominal colored rectangles, and positioned across x and y accordingly
- the text “project1”, “project2”, etc, is layered text
This kind of description is consistent with a so-called “grammar of graphics” approach to visualization.
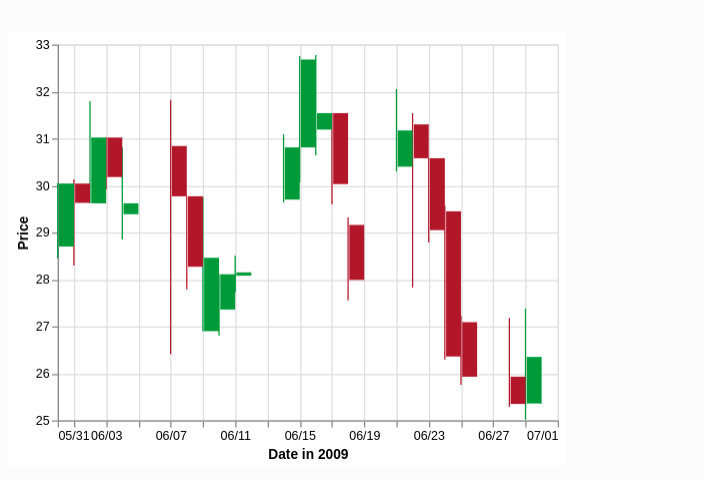
I’m fairly certain that the Altair plotting package (available in Anvil), could make a chart that could represent your data in this way. Maybe you could have a look at the Altair examples to see how you might modify something that looks close. Obviously the following examples are not exactly what you want, but in many respects, they aren’t that far away either.
Anyway, that is just what comes to mind in terms of visualization based on what you shared.