Chapter 1:
Build your user interface
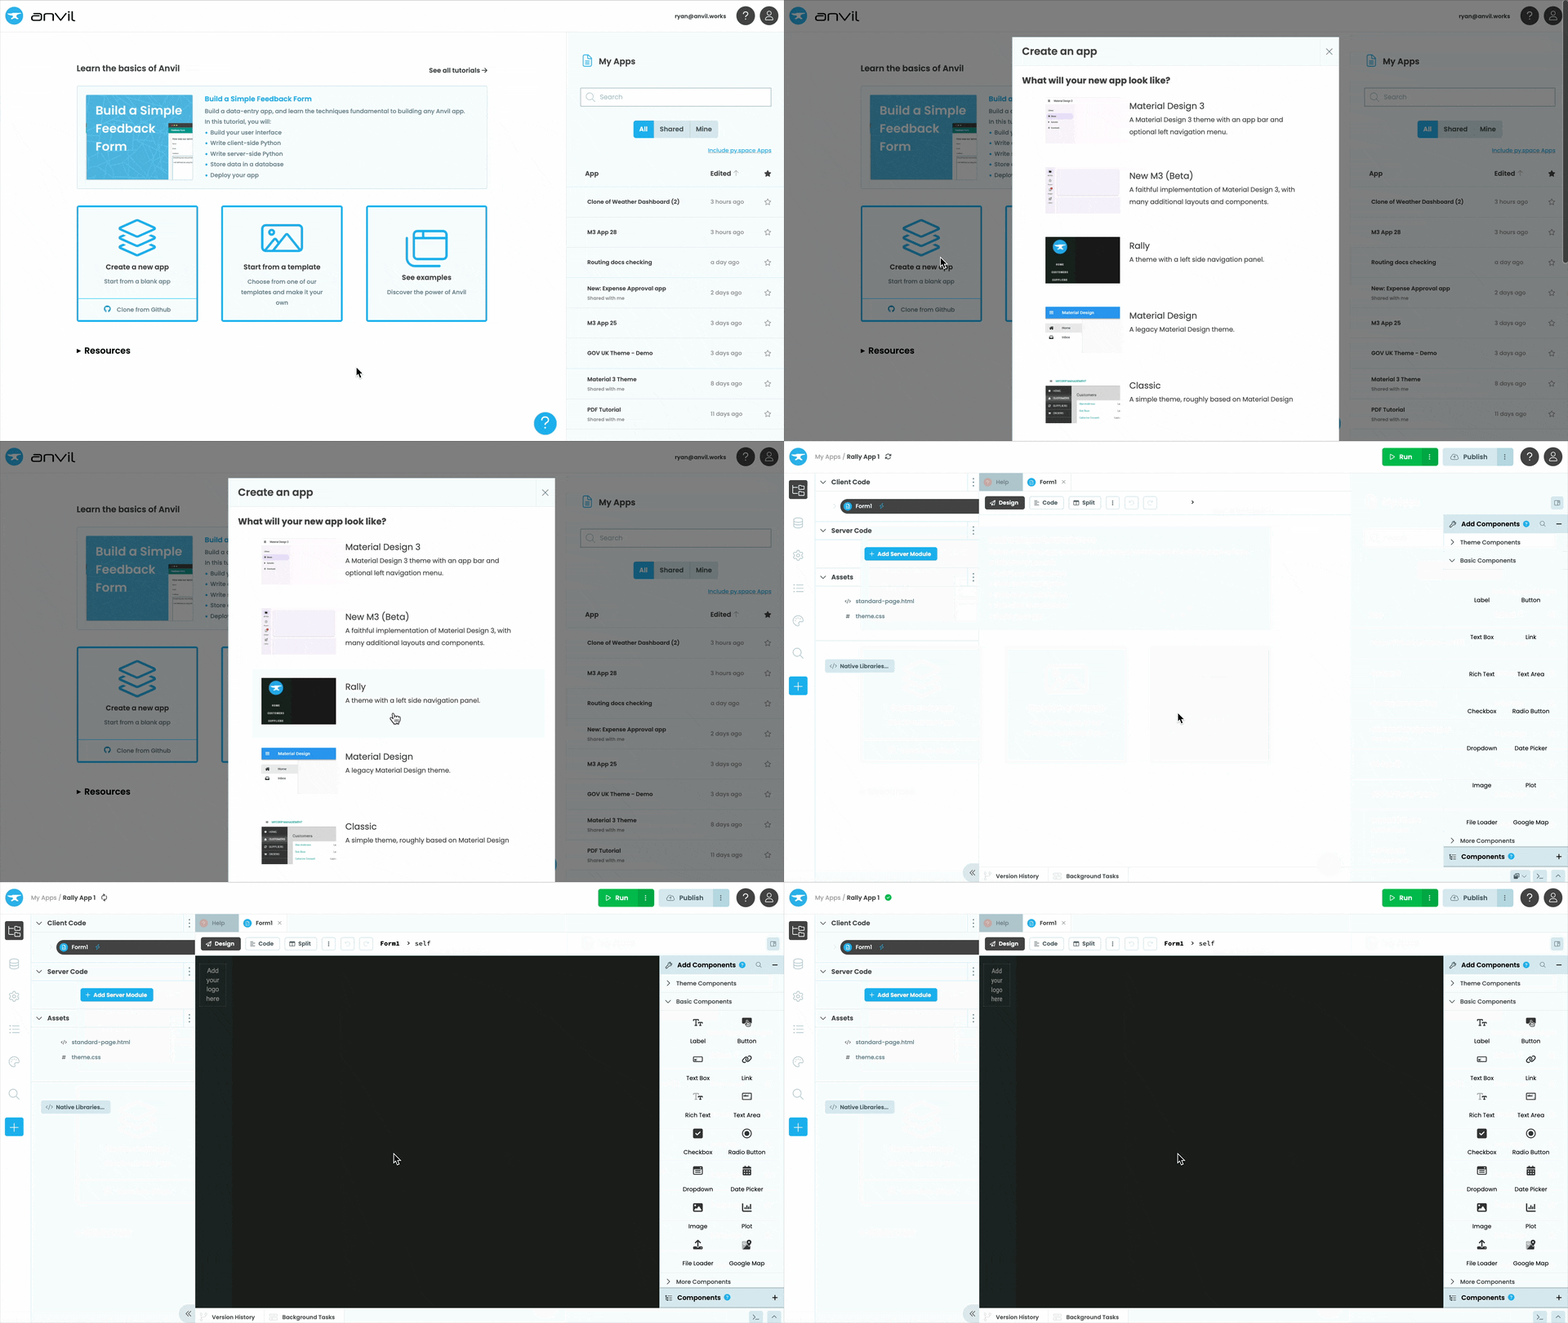
Step 1: Create a new app
Start by going to the Anvil Editor, click on “Blank App” and choose the Rally theme. On the top left corner of the screen, click on the app’s name. This takes us to the General Settings page, where we can modify our app’s name. Change the app’s name to ‘Weather Dashboard’.

Step 2: Add your first components
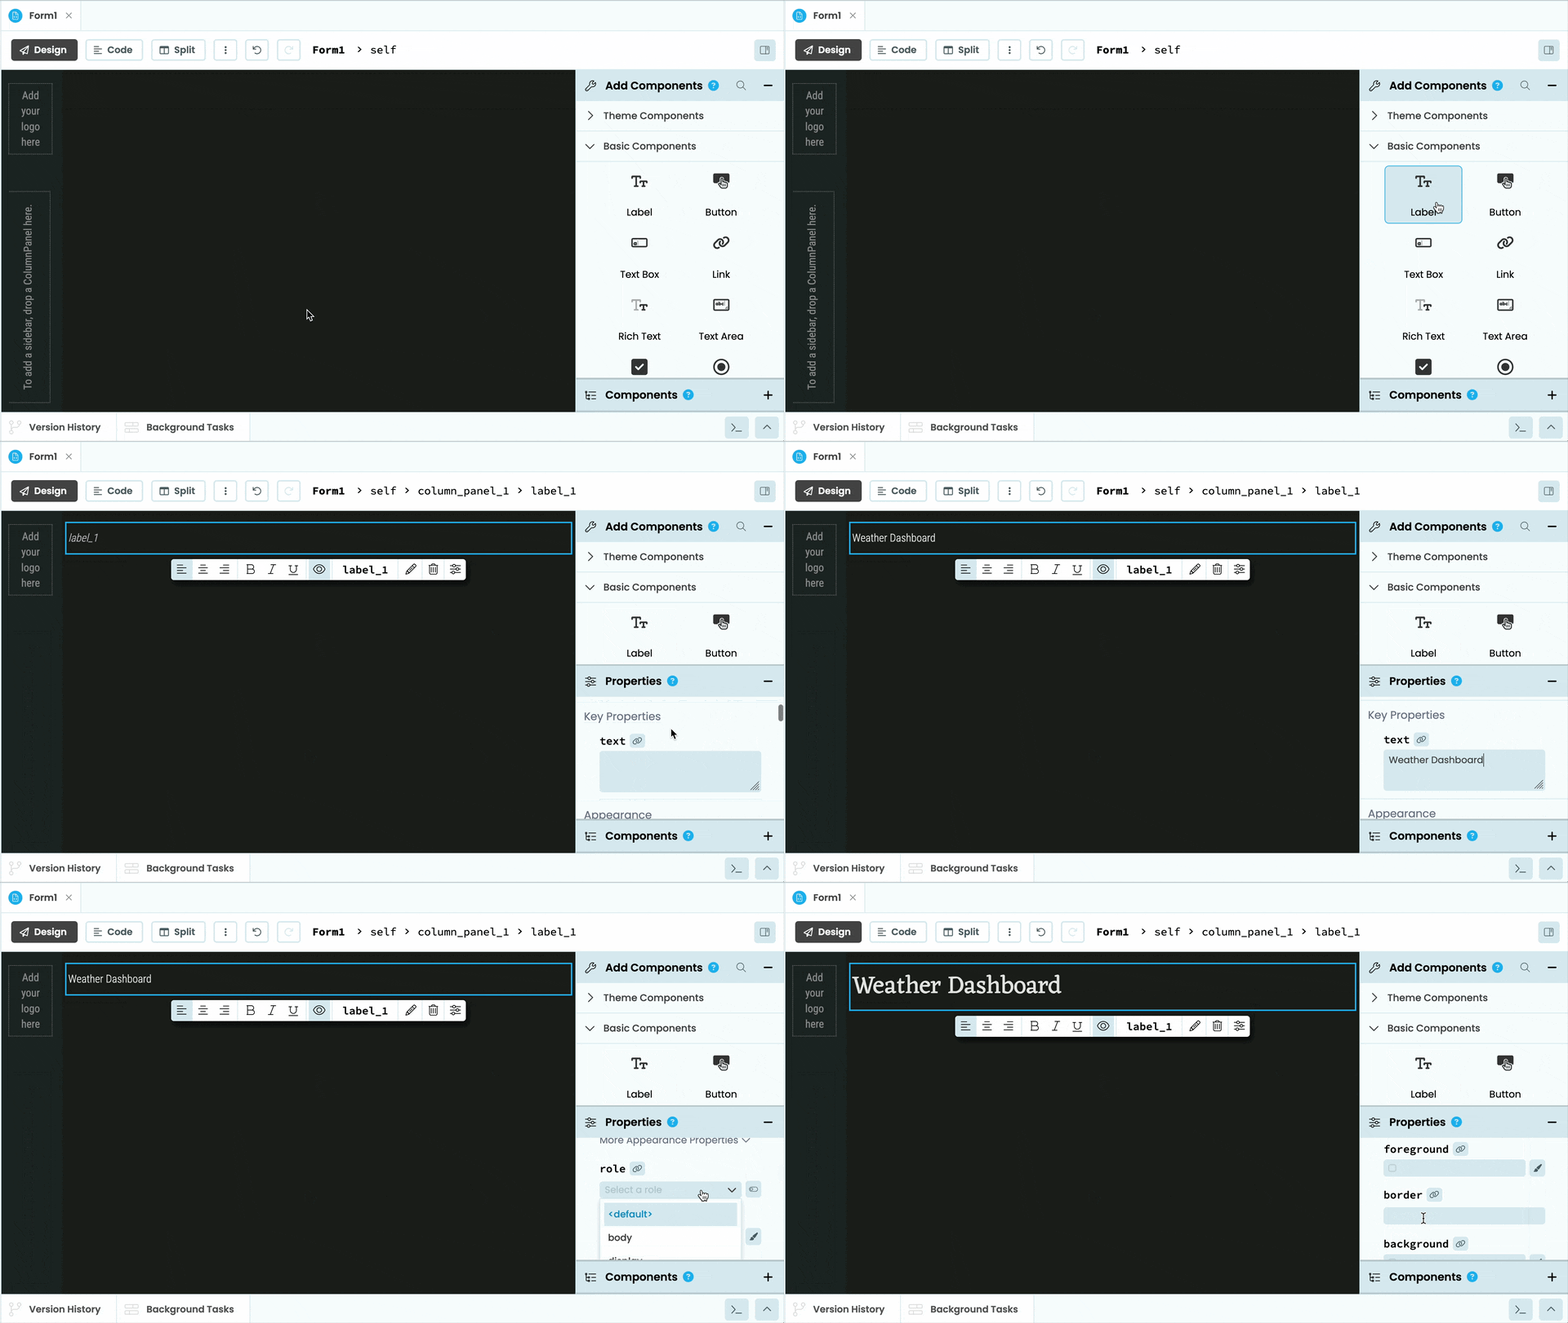
Let’s go to the ‘App’ section in the Sidebar Menu, and choose Form1. We will build our user interface by adding components from the Toolbox.
First, we’ll add a title. Drag and drop a Label to the top of the app. In the Properties Panel, we’ll change the Label’s text to Weather Dashboard and its role to ‘headline’.

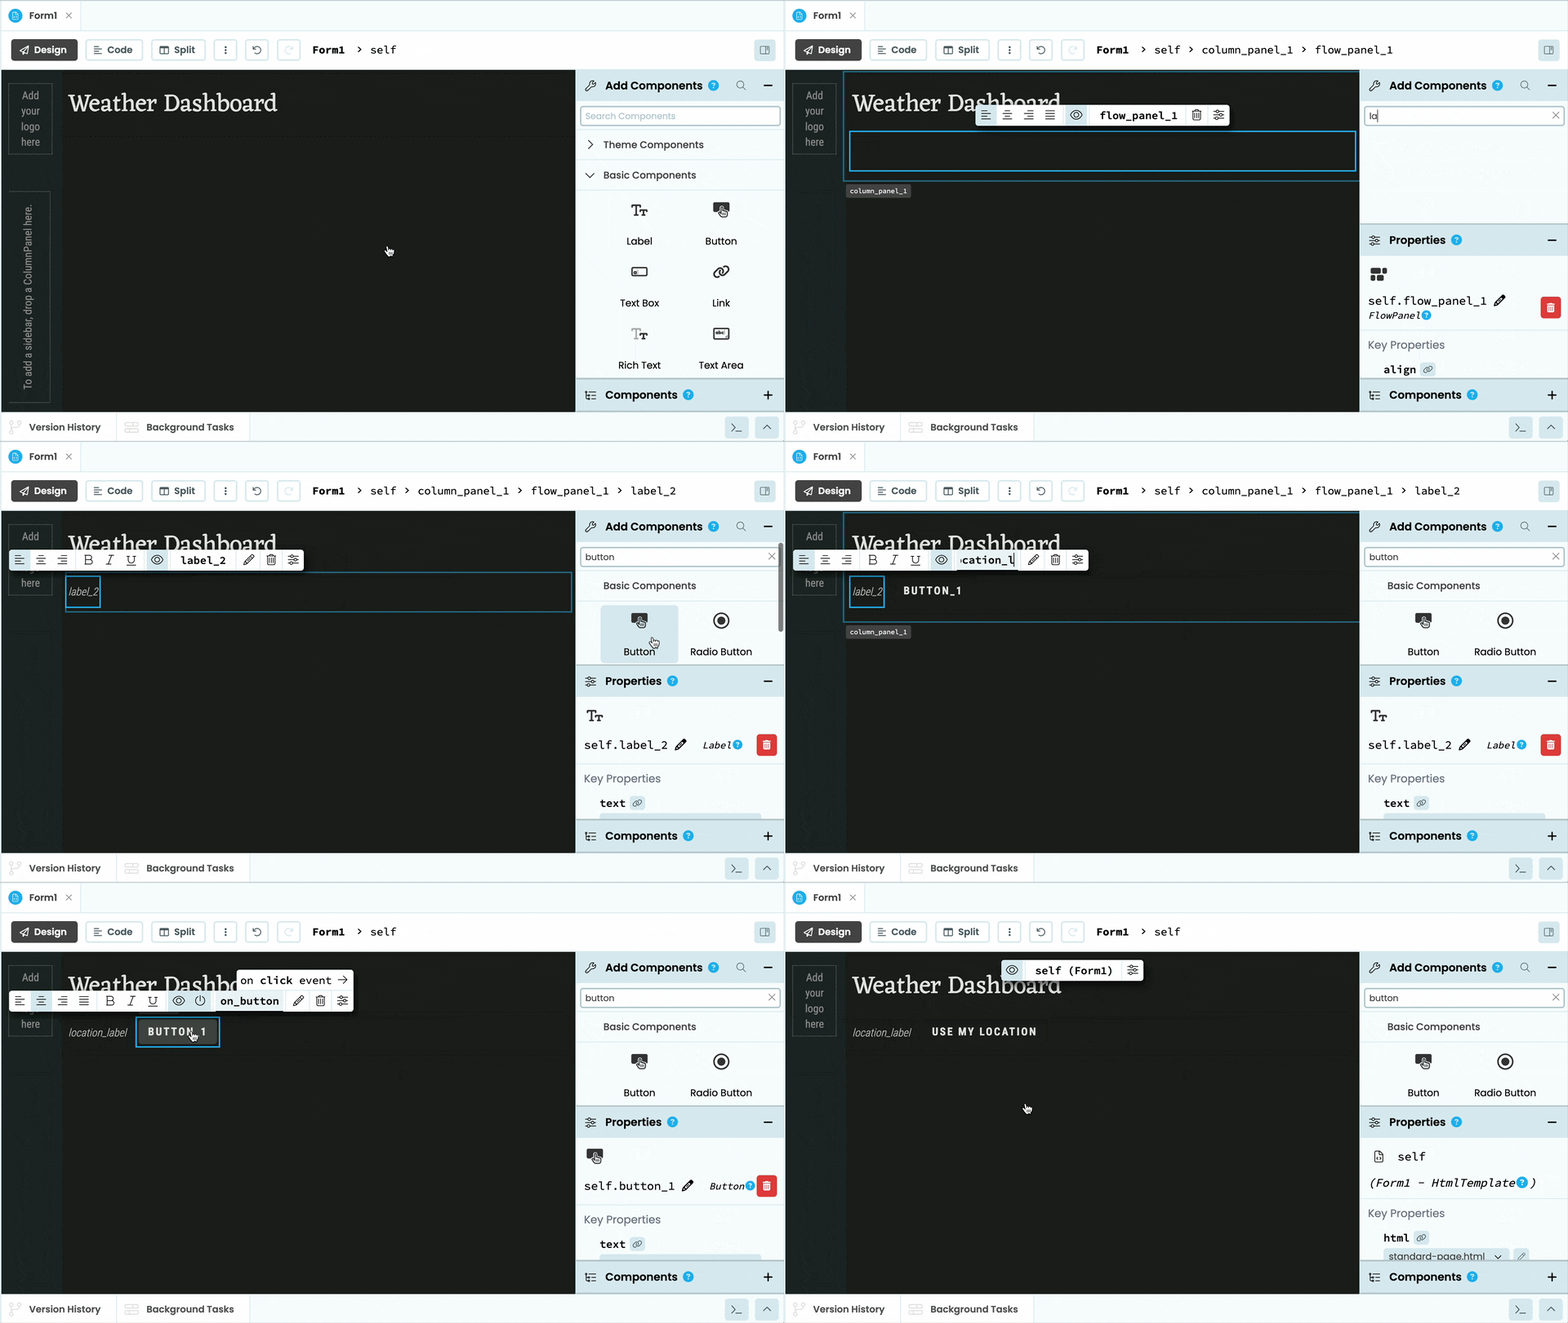
Under the title, we’ll add a FlowPanel, and inside it, a Label and a Button. Change the name of the Label to location_label and the name of the Button to location_button and its to “Use my location”.

Step 3: Add the rest of your components
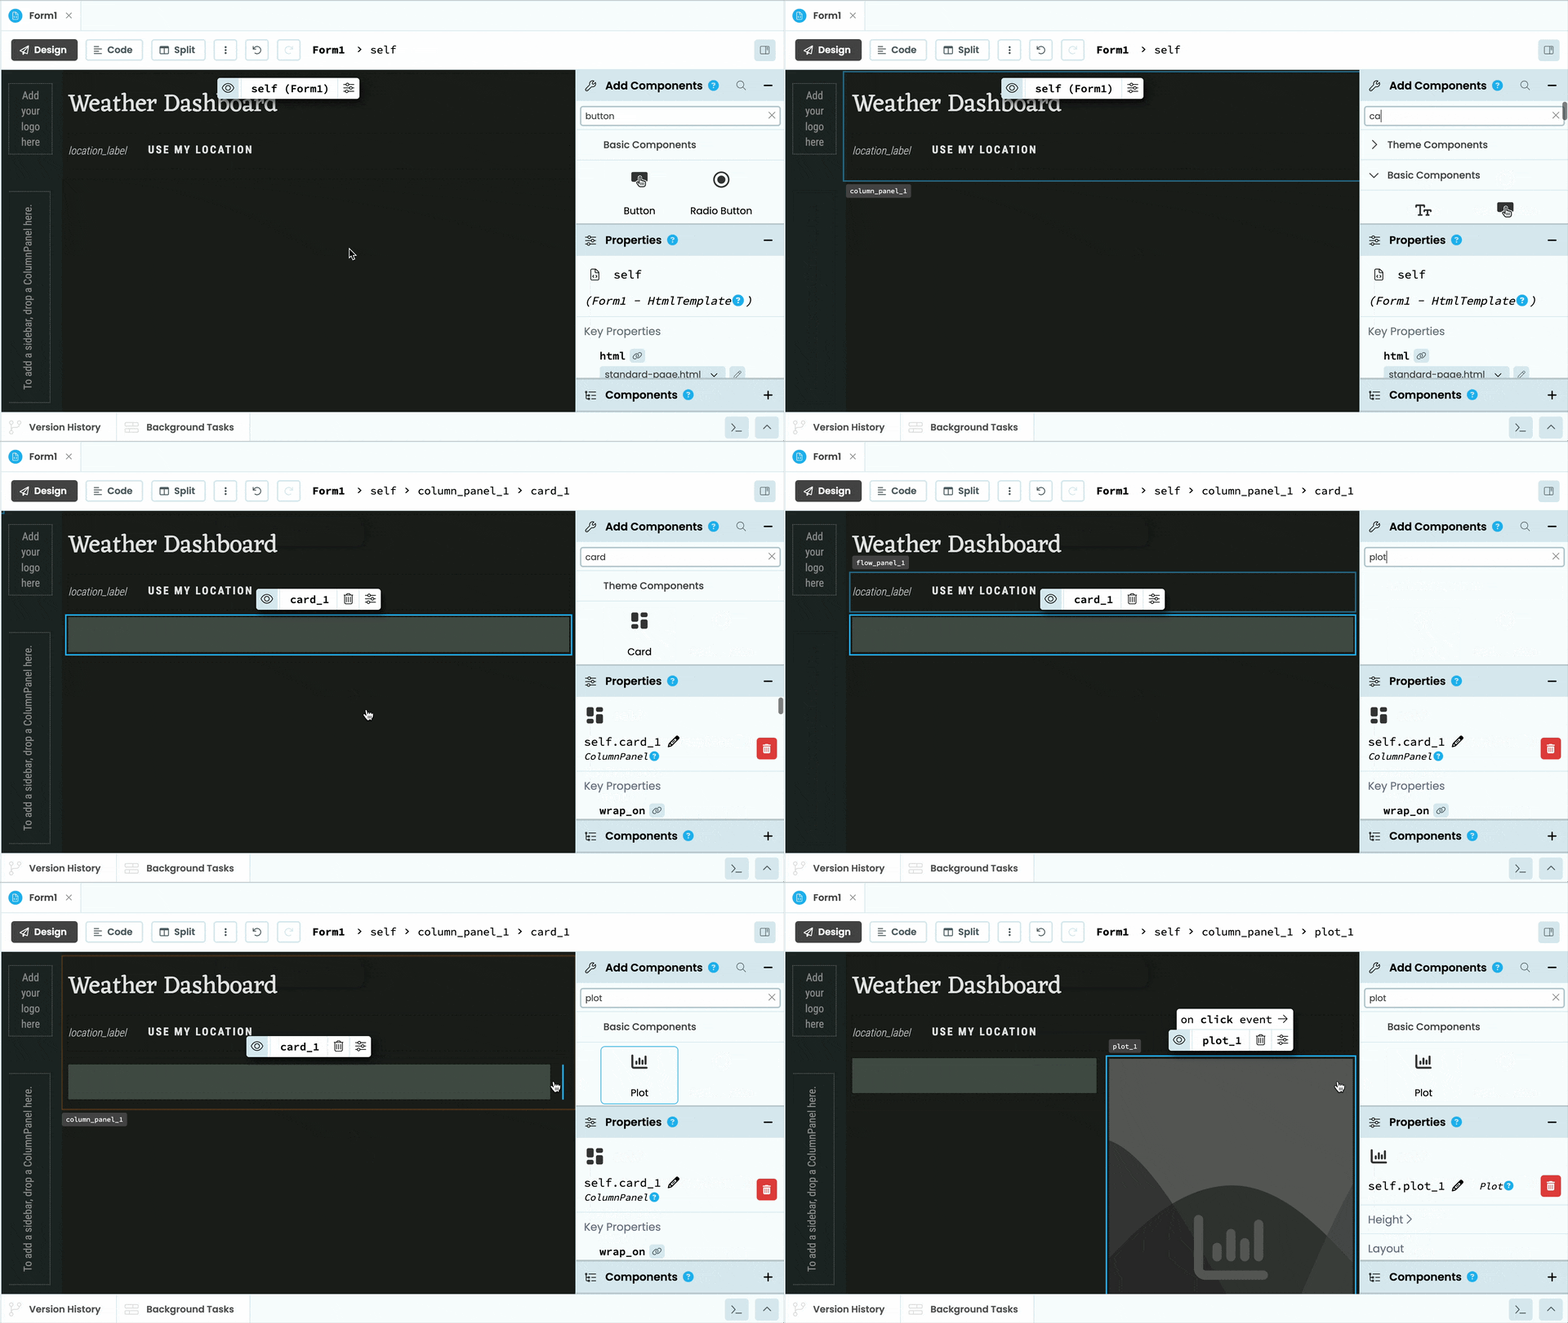
We’re going to build a dashboard which contains a summary card for the current weather and a 5-day Forecast plot, so let’s put the necessary components in place.
Below the FlowPanel, add a Card and a Plot component, one next to the other.

Inside the card we will display information about the current weather. So let’s add the following components to the card and rename them as we go. This will make it easier to access them from code later. Add the following:
- Label, we’ll rename it to
description_label, set itsroleto ’title’, and under Text, setalignto center. - Image, we’ll rename it to
icon. - Label, rename it to
temp_label, set itsroleto ‘display’, and under Text, setalignto center. - A FlowPanel, set
alignto center and inside it, add two more Labels and rename them tomax_labelandmin_label.
Once you’ve added all of your components, you can play around with the positioning as you like. This is how my dashboard looks so far:

With this, our UI is finished. Now, let’s write some code to get the data from the API.
 By
By