 By
By Putting a web front-end on a Google Colab notebook
Let’s say you’re a data scientist, and you’ve been asked to classify iris flowers based on their measurements (using the famous iris dataset). You’ve written some code in a Colab notebook that solves the problem; however, what you really want is to build an interactive tool, so people can classify the flowers themselves!
In this short tutorial, we are going to build an interactive tool for people to classify iris flowers by connecting a web app to a Colab notebook. The web app will collect the iris measurements from the user, send the data to our Colab notebook, where it will be classified, and then send the classification back to our web app to display to the user.
For this tutorial you will need to know basic Python and have an understanding of how to use Google Colab notebooks.
Let’s get started.
Step 1 - Create your Anvil app
Creating web apps with Anvil is simple. No need to wrestle with HTML, CSS, JavaScript or PHP. We can do everything in Python.
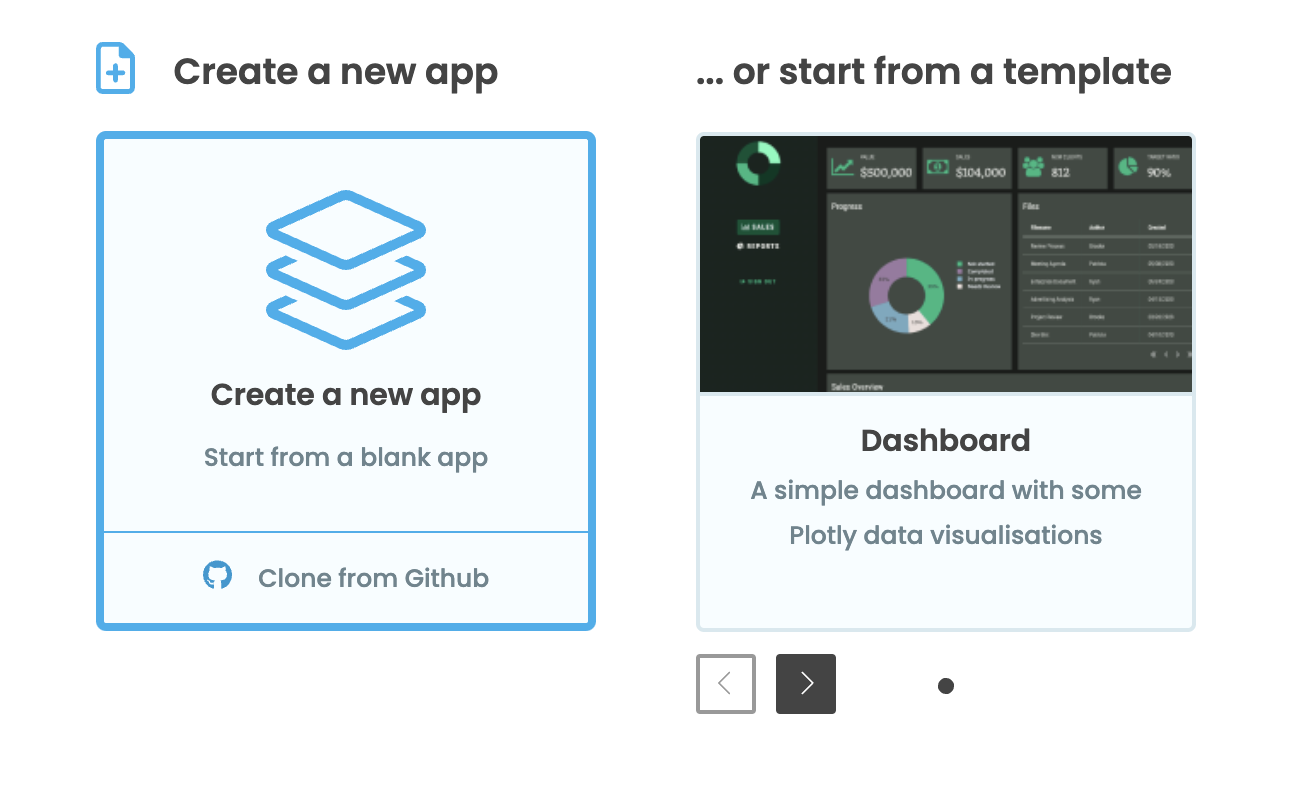
Log in to Anvil and click ‘New Blank App’. Choose the Material Design theme.
First, name the app. Click on the name at the top of the screen and give it a name.
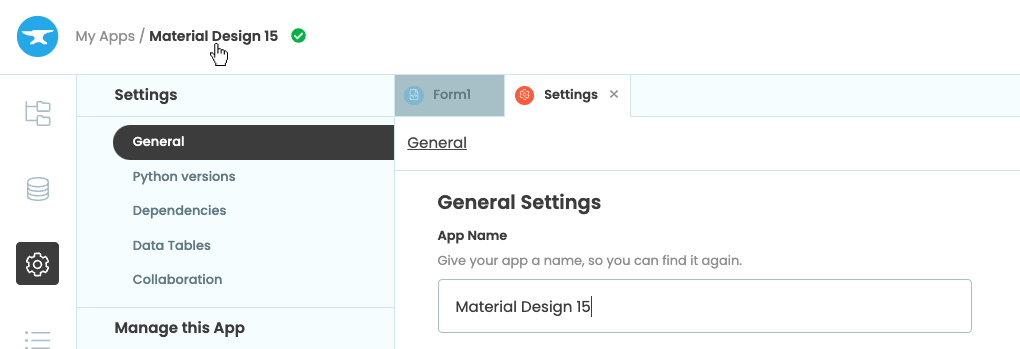
Rename your app by clicking on the title
Step 2 - Design your page
To classify the species of iris a flower comes from, we need to collect several measurements, so let’s design the user interface for entering that data.
We construct the UI by dragging-and-dropping components from the Toolbox. Let’s start by dropping a Card  into our form – this will be a neat container for the other components. Then let’s add a Label
 ![]() and a TextBox
and a TextBox ![]() into the card component:
into the card component:
Drag and Drop a Card, Label and TextBox
Next we will set up the Label and TextBox components to collect enter the sepal length.
Select the Label we just added and, in the properties panel on the right, change the text to ‘Sepal length: ’ and align the text to the right.
Then select the TextBox we added and change the name to sepal_length, change the placeholder text to ‘(cm)’ and align the text to the centre.
Change the properties of the Label and TextBox
Repeat this process adding labels and text boxes for the other parameters we need: sepal width, petal length and petal width. This will capture all the information we need to classify each iris flower.
Next, let’s add a Button  to run the classifier. Name it
 categorise_button and change the text to ‘Categorise’. Clicking this button will trigger a Python function to send the iris measurements to our Colab notebook. (We’ll set that up in a moment.)
Add a Button component to our UI
Finally, let’s add a Label where we’ll display our results. Put it below the button, call it species_label, centre the text and untick the visible tick box in the properties panel so it doesn’t appear immediately. In step 3 we will create an event handler function that makes the label visible, and uses it to display data returned from our Colab notebook.
Add a Species label to our UI
Our app should now look like this:
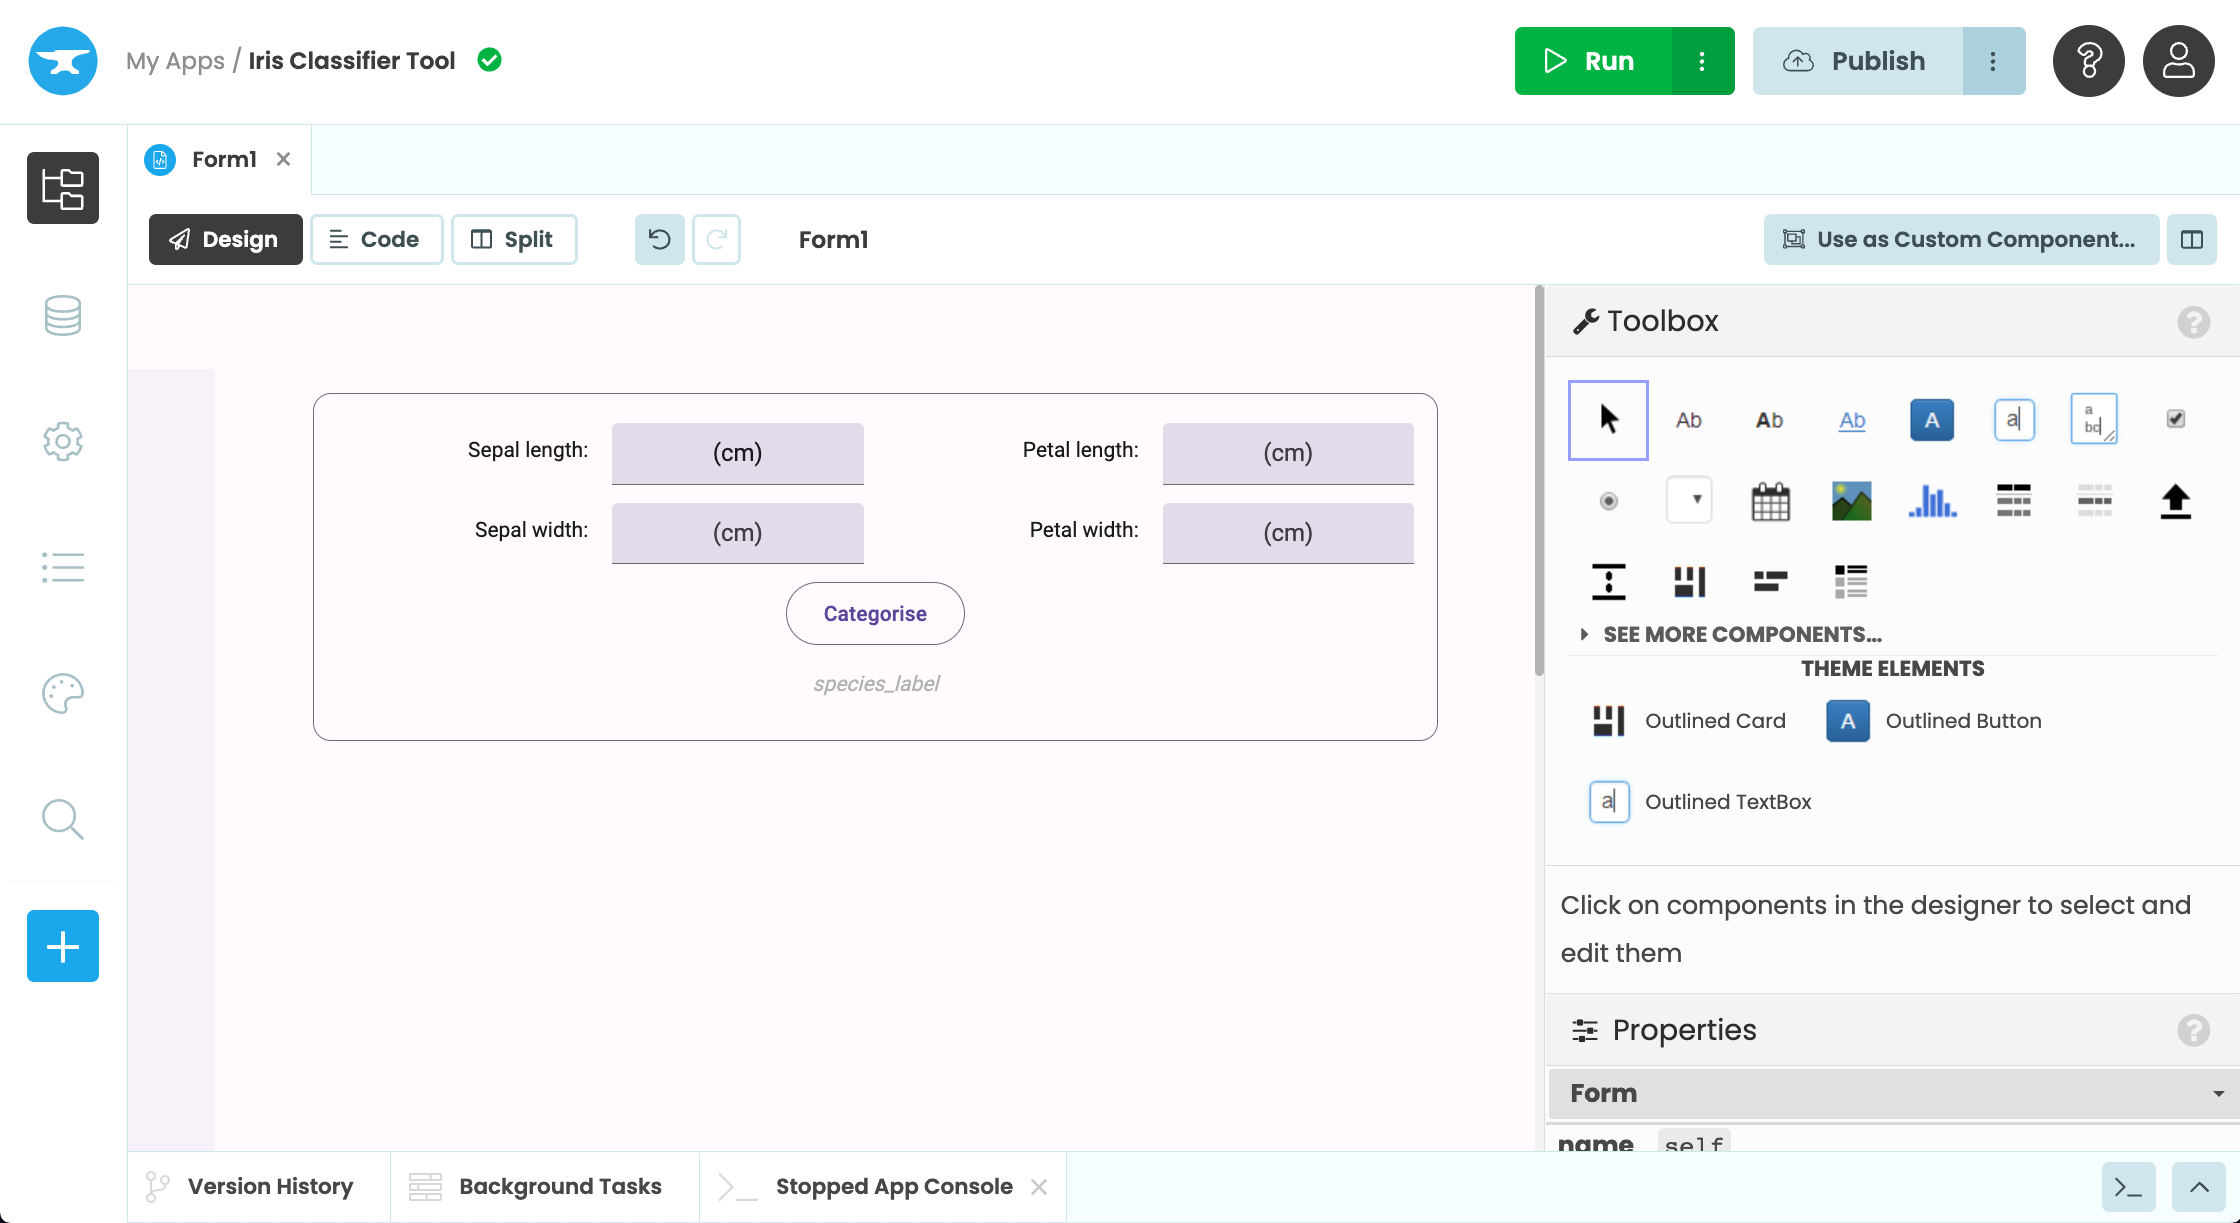
The finished Google Colab app UI
In the next step we will add some code to control what happens when a user pushes the Categorise button.
Step 3 - Add a button click event
We want our categorise_button to do something when it’s clicked, so let’s add a click event.
With the button selected, go to the bottom of the properties panel. Then click the blue button with two arrows in it next to the click event box. This will open our code view and create a function called categorise_button_click(). From now on, every time the button is clicked by a user, this function will be called.
Adding a click event handler to the Categorise button
We want to call a function in our Google Colab notebook, and pass it the measurements the user has entered into our web app. When the notebook returns our answer, we’ll display it as text on the species_label:
To do this we add the following:
def categorise_button_click(self, **event_args):
    """This method is called when the button is clicked"""
    # Call the google colab function and pass it the iris measurements
    iris_category = anvil.server.call('predict_iris',
                                self.sepal_length.text,
                                self.sepal_width.text,
                                self.petal_length.text,
                                self.petal_width.text)
    # If a category is returned set our species
    if iris_category:
      self.species_label.visible = True
      self.species_label.text = "The species is " + iris_category.capitalize()
Now we have a basic UI and functionality, let’s connect our app to the code in our Google Colab notebook.
Step 4 - Enable the Uplink
From the Anvil editor, let’s enable the Uplink. This gives us everything we need to connect our web app to our Colab notebook. Select the blue ‘+’ button in the Sidebar Menu to open the list of available services. Then add the Uplink and click ‘Enable Server Uplink’:
Activating the Uplink
This will then give us an Uplink key we can use in our Google Colab notebook, to connect to this app.
Now let’s install the Uplink in our Colab environment, and connect our script using the key we just created.
Step 5 - Install the Uplink Library in our Colab Environment
In the next few steps, we will be connecting a Colab notebook to the web app we have built. For simplicity, I’ve created a notebook that already handles the iris classification for us. Make a copy of the following notebook to follow along:
The first thing we need to do is install the anvil-uplink library in our Colab environment. Let’s add !pip install anvil-uplink to the top of our notebook.
!pip install anvil-uplinkThe ! operator tells our notebook that this line is a command line script and not Python code.
Step 6 - Connecting our Script
Now that the Uplink library will be installed when we start our notebook, we can connect our notebook in the same way as any other Uplink script.
Start by importing the anvil.server module:
import anvil.serverThen connect to the Uplink:
anvil.server.connect("your-uplink-key")Replace “your-uplink-key” with the Uplink key from your app.
That’s it! When we run our notebook, it will now connect to our web app via the Uplink. Next, let’s create a function we can call from our Anvil app.
Step 7 - Creating a callable function
With a classification model built and trained, we can create a function that takes our iris data and returns the name of the iris species. Let’s create a predict_iris function and add @anvil.server.callable so it is available to call from our app.
@anvil.server.callable
def predict_iris(sepal_length, sepal_width, petal_length, petal_width):
  classification = knn.predict([[sepal_length, sepal_width, petal_length, petal_width]])
  return iris.target_names[classification][0]
Finally at the end of our notebook we will call the wait_forever() function. This keeps our notebook running and allows our app to call functions indefinitely.
anvil.server.wait_forever()Run the notebook. You should see output like this:
Connecting to wss://anvil.works/uplink
Anvil websocket open
Authenticated OK
Step 8 - Publishing your app
Now we have our app and script connected, all we have to do is publish our app for our colleagues to use.
Click the ‘Publish’ button at the top right of the editor, then select ‘Publish this app’ and use the public URL provided or enter your own.
Publishing and using our classification app
That’s it, our notebook is now connected to our Anvil app and anyone with access to your web app can now interact with code in your Google Colab notebook.
Our app has one final problem, Colab notebooks shut down after a certain amount of time. This means our model won’t be available 24/7 and our app will stop working. To solve this we need to export the model from our Colab notebook and deploy it somewhere else.
Step 9 - Deploying your model
There are two ways to deploy our model and keep it available for our Anvil app to use.
Firstly, we can host the model on our own computer and connect our app to the model using the Anvil Uplink. Here’s a full tutorial which shows you exactly how to do this for free:
The second solution is to deploy our model online with Anvil. This is the simplest way to deploy both our app and model - hosting the model online requires a paid account. Let me quickly show you how it works.
Downloading your model
We’ll start by going back into our Colab notebook. At the end of the cell that builds and trains the iris classification model, we’ll import the joblib library and the files module from google.colab.
...
knn = KNeighborsClassifier(n_neighbors=10)
knn.fit(X,y)

import joblib
from google.colab import files

model = joblib.dump(knn, "knn.skmodel")[0]
files.download(model)
Downloading the iris model from the Colab notebook
Uploading the model to our app
Now, back in the Anvil editor, let’s add the Data Files service. Select the blue ‘+’ button in the Sidebar Menu and add Data Files.
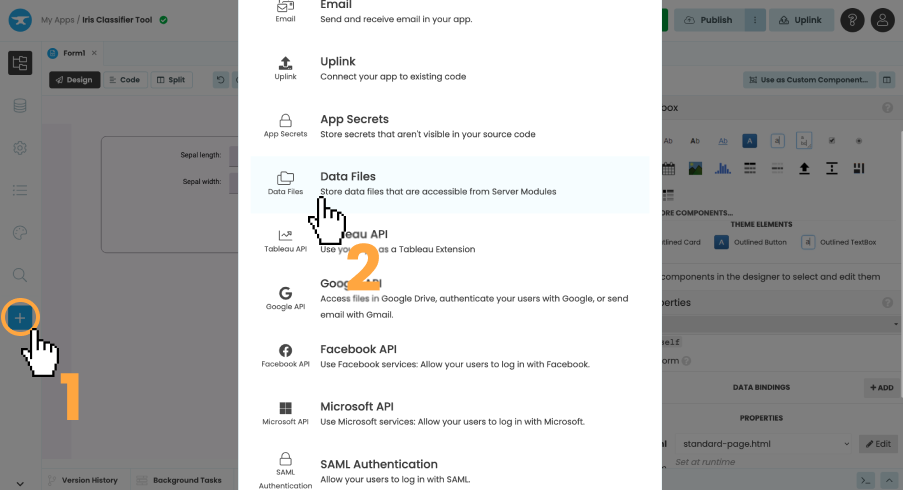
Adding the Data Files service
Next, we can upload our model as a file by clicking the ‘Upload’ button and selecting the model we downloaded earlier.
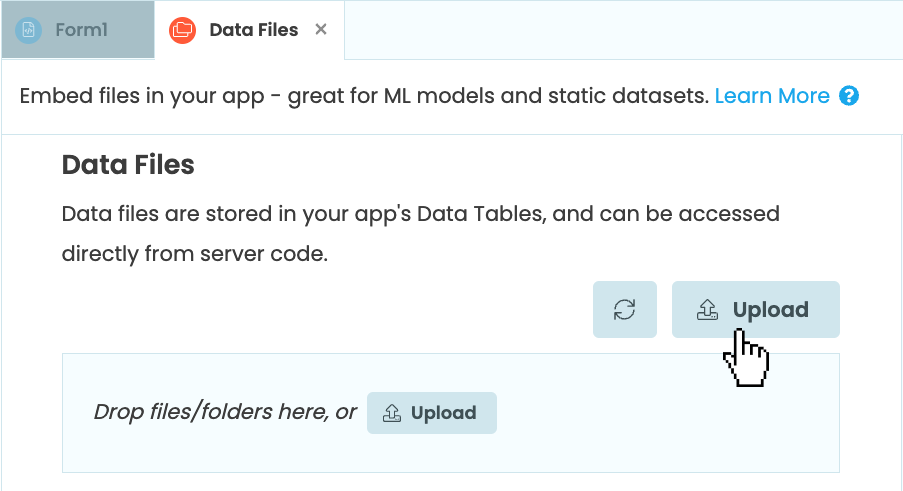
Click the ‘Upload’ button
Here’s a Gif of the full process for uploading your model:
Adding the Data Files service and uploading our model
Configuring your server environment
With our model uploaded, we need to configure our app’s server environment to include all the packages we need to use the model.
We’ll start by selecting settings icon ![]() from the Sidebar Menu and opening ‘Python versions’.
from the Sidebar Menu and opening ‘Python versions’.
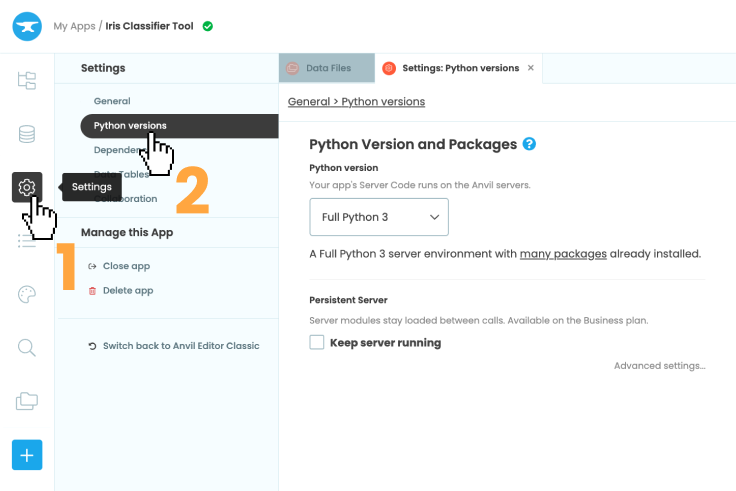
Opening the settings menu
Then, in the Python version dropdown, select ‘Python 3.10’. Under ‘Base packages’, choose the ‘Machine Learning’ base image. This includes all of the packages we’ll need to run the model.
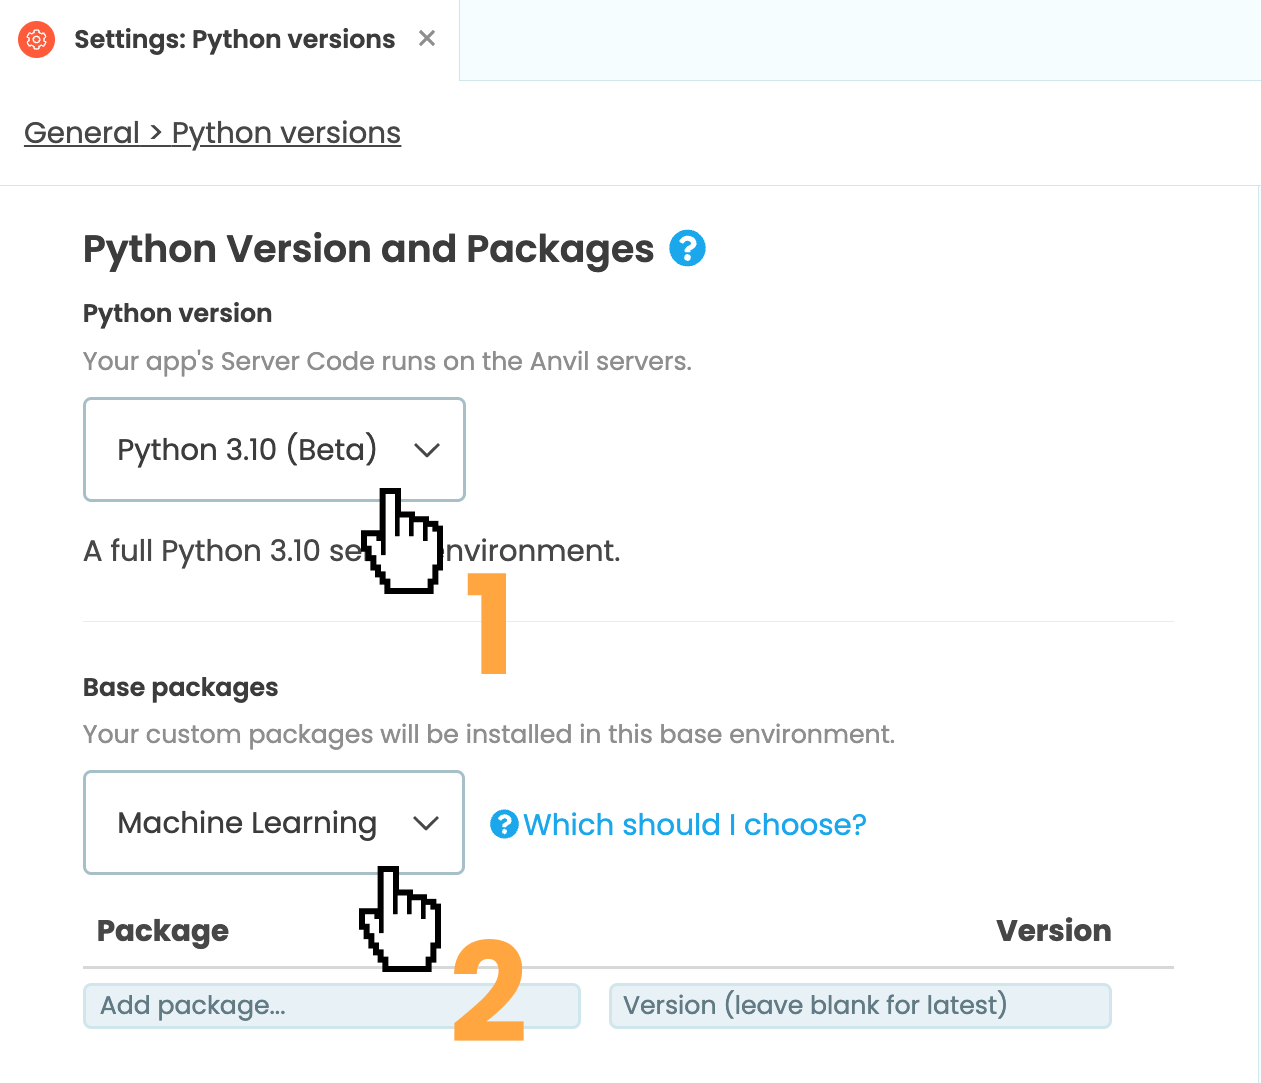
Changing the Python version to ‘Python 3.10’
and the base package to ‘Machine Learning’
With our server environment configured, it’s time to start using our model.
Using your hosted model
Create a Server Module by selecting the App Browser ![]() in the Sidebar Menu and clicking ‘+ Add Server Module’.
in the Sidebar Menu and clicking ‘+ Add Server Module’.
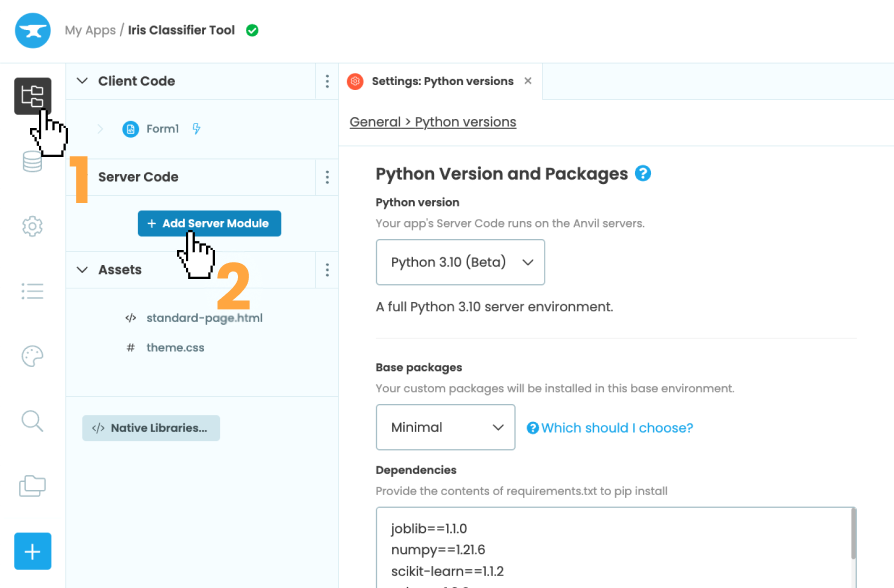
Opening the settings menu
At the top of our server module, let’s import the joblib library we need to load our model and import load_iris from sklearn’s built-in iris dataset.
import joblib
from sklearn.datasets import load_iris

iris = load_iris()
The same as we did in our Colab notebook, let’s define the predict_iris function that takes the flower measurements.
@anvil.server.callable
def predict_iris(sepal_length, sepal_width, petal_length, petal_width):
Inside the predict_iris function, we’ll reconstruct our model using joblib.load(). We will get the path to the model file on disk using data_files['knn.skmodel']. Lastly, we’ll get the classification using the same code we used in our Colab notebook.
@anvil.server.callable
def predict_iris(sepal_length, sepal_width, petal_length, petal_width):
  # Reconstruct our model
  model = joblib.load(data_files['knn.skmodel'])

  # Get the classification of the iris
  classification = model.predict([[sepal_length, sepal_width, petal_length, petal_width]])
  return iris.target_names[classification][0]
And that’s it! If we go to our app’s URL now and enter some iris measurements, our app will use our Machine Learning model that’s deployed online with Anvil.
Using the finished app and
model - both deployed with Anvil
Clone the App
For those of you who want to see the source code for this app:
New to Anvil?
If you’re new here, welcome! Anvil is a platform for building full-stack web apps with nothing but Python. No need to wrestle with JS, HTML, CSS, Python, SQL and all their frameworks – just build it all in Python.
Yes – Python that runs in the browser. Python that runs on the server. Python that builds your UI. A drag-and-drop UI editor. We even have a built-in Python database, in case you don’t have your own.
Why not have a play with the app builder? It’s free! Click here to get started: