@meredydd - Gotta say that I’m absolutely in love with Anvil … wondering if there are any plans to include the networkx library to make graphs available to plotly. Right now I’m noodling around ideas to get networkx plotly graphs back into my Anvil app … ideas or recommendations?
Hi @greg, here’s a couple of ideas you might like to play with.
You could follow the procedure of the Using Matplotlib With Anvil howto, and construct the plot on the server to be returned as an image. Currently, networkx, psutil and plotly aren’t installed in the Server Module runtime so you need to do this in an Uplink script for now.
Here’s a script based on this Plotly example that returns a BlobMedia object to be rendered in the browser. (And here’s the Plotly guide to static image export.)
#!/usr/bin/env python3
import plotly.plotly as py
import plotly.graph_objs as go
import plotly.io as pio
import networkx as nx
import anvil.server
from anvil import BlobMedia
anvil.server.connect("<your uplink key goes here!>")
@anvil.server.callable
def make_plot():
G=nx.random_geometric_graph(200,0.125)
pos=nx.get_node_attributes(G,'pos')
dmin=1
ncenter=0
for n in pos:
x,y=pos[n]
d=(x-0.5)**2+(y-0.5)**2
if d<dmin:
ncenter=n
dmin=d
p=nx.single_source_shortest_path_length(G,ncenter)
edge_trace = go.Scatter(
x=[],
y=[],
line=dict(width=0.5,color='#888'),
hoverinfo='none',
mode='lines')
for edge in G.edges():
x0, y0 = G.node[edge[0]]['pos']
x1, y1 = G.node[edge[1]]['pos']
edge_trace['x'] += tuple([x0, x1, None])
edge_trace['y'] += tuple([y0, y1, None])
node_trace = go.Scatter(
x=[],
y=[],
text=[],
mode='markers',
hoverinfo='text',
marker=dict(
showscale=True,
# colorscale options
#'Greys' | 'YlGnBu' | 'Greens' | 'YlOrRd' | 'Bluered' | 'RdBu' |
#'Reds' | 'Blues' | 'Picnic' | 'Rainbow' | 'Portland' | 'Jet' |
#'Hot' | 'Blackbody' | 'Earth' | 'Electric' | 'Viridis' |
colorscale='YlGnBu',
reversescale=True,
color=[],
size=10,
colorbar=dict(
thickness=15,
title='Node Connections',
xanchor='left',
titleside='right'
),
line=dict(width=2)))
for node in G.nodes():
x, y = G.node[node]['pos']
node_trace['x'] += tuple([x])
node_trace['y'] += tuple([y])
for node, adjacencies in enumerate(G.adjacency()):
node_trace['marker']['color']+=tuple([len(adjacencies[1])])
node_info = '# of connections: '+str(len(adjacencies[1]))
node_trace['text']+=tuple([node_info])
fig = go.Figure(data=[edge_trace, node_trace],
layout=go.Layout(
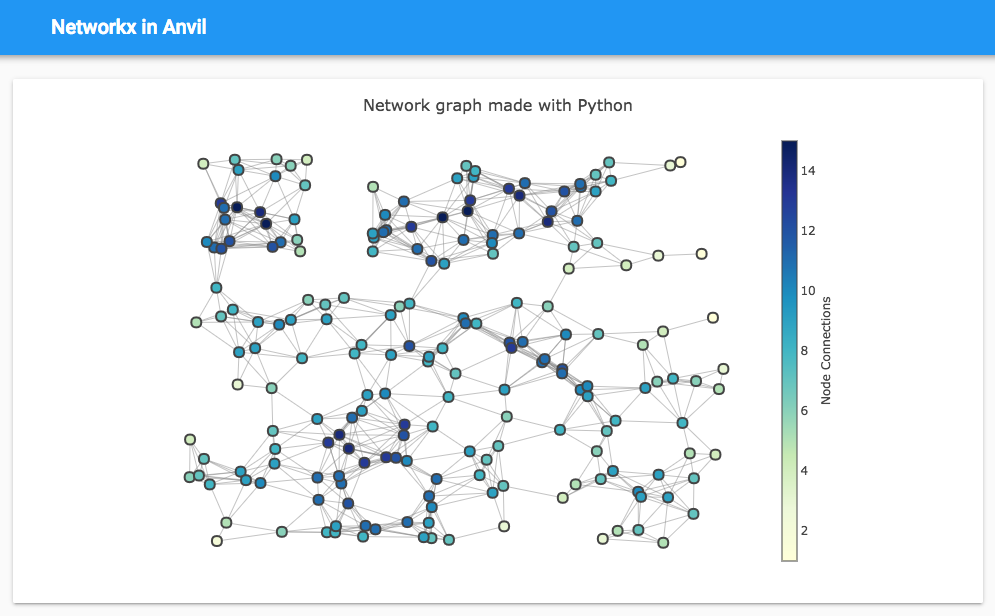
title='Network graph made with Python',
titlefont=dict(size=16),
showlegend=False,
hovermode='closest',
margin=dict(b=20,l=5,r=5,t=40),
xaxis=dict(showgrid=False, zeroline=False, showticklabels=False),
yaxis=dict(showgrid=False, zeroline=False, showticklabels=False)))
return BlobMedia("image/png", pio.to_image(fig, format='png'), name="graph.png")
anvil.server.wait_forever()
On the client side, there’s an Image with its display_mode set to original_size that gets the BlobMedia object set to its source:
    img = anvil.server.call('make_plot')

    self.image_1.source = img
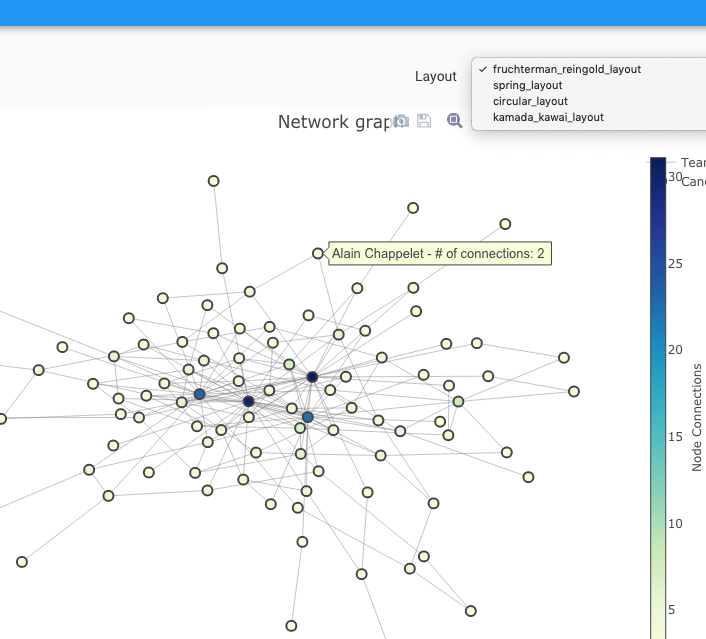
A downside is that the image is static, you don’t get the interactive hovering over nodes or zooming of the plot. The problem is that Uplink scripts can’t return Plotly graph objects, so the plotly stuff has to be done on the server. If you can find ways to do what you want by passing basic Python datastructures (lists, dictionaries, …) between networkx and plotly, that makes life a lot easier, because you can run networkx either from an Uplink script or the JavaScript port, and pass the data into the client-side Plotly Python binding to create interactive plots.
There’s a JavaScript port of Networkx. You could include it in a CustomHTML form using a <script> tag and use call_js and anvil.call to call between Python and JavaScript. You might still be limited by what you can pass between JS and Python, and the JS port doesn’t yet have all of Networkx’s features, so the Uplink script is probably a better option (and if I were you I’d prefer to use Python!)
Hi Shaun, thanks for this!
I was able to get networkx (via uplink) and the network graph rendered (via plotly on the Anvil UI side) by teasing apart the node and edge generation (doing that in the remote uplink code). This doesn’t work for every layout algorithm but most layouts I tried are serialize-able and can be sent back to Anvil where I do all the ployly fun stuff to generate the graph.
Your response really helped because it opened my eyes to the incredible power (and ease) of the Anvil uplink functionality.
Thansk!
Greg
2 Likes
Nice! I’m glad you figured out a way to make most stuff serializable.